


Fire blight is caused by the pathogen, Erwinia amylovora (Burr.), and it is classified as a regulated pests in the Plant Protection Act in Korea; therefore, eradication with the aim of suppressing spread is required (Kim and Yun, 2018; Park et al., 2017). The Rural Development Administration classifies the four areas in which the disease is managed as occurrence areas where fire blight has occurred; buffer areas in close proximity to the occurrence areas, nonincidence areas, and special control areas. For the nonoccurrence and special control areas, all trees in an orchard that is discovered with fire blight symptoms are required to be buried. If the disease occurs again within 6 months, all host plants within a 100 m radius from the original site of occurrence are removed. In the buffer areas, all trees are buried in orchards with fire blight symptoms. In the occurrence areas, the eradication program is applied based on the number of trees. For orchards in the occurrence areas with more than 100 apple trees, only trees near the site of occurrence are removed. However, if the disease persists for more than 6 weeks in these orchards, the entire orchard is buried. For orchards containing less than 100 trees, the entire orchard is buried if the plant incidence rate is greater than 5%, but only trees near the site of occurrence are removed if the rate is below 5%.
The first outbreak of fire blight in Korea was recorded in 2015 in apple and pear trees in Anseong, Gyeonggi-do; Cheonan, Chungcheongnam-do; and Jecheon, Chungcheongbuk-do (Park et al., 2016). The areas affected by fire blight have expanded from 2015 to 2020 to include Chungcheongbuk-do (Chungju, Jecheon, Eumseong, and Jincheon), Gangwon-do (Pyeongchang), Gyeonggi-do (Anseong, Pyeongtaek, Yangju, Gwangju, Icheon, Paju, and Yeoncheon), Chungcheongnam-do (Asan, Cheonan), and Jeollabuk-do (Iksan), and they continue to expand rapidly (Ham et al., 2020; Kim et al., 2019). In particular, 413.4 ha, which is 63.1% of the apple orchards in Chungju, Jecheon, and Eumseong in Chungcheongbuk-do were buried over the last 6 years, and 384.4 ha of those areas were buried in 2019-2020 due to a sharp increase in the incidence of fire blight.
Cankers sometimes appear in an ooze-like form when the temperature rises in spring, and they become incubators for fire blight pathogens (Beer and Norelli, 1977). The pathogens exposed to the edge of the canker are transported to the stigma of the flower by pollinators, such as honeybees or other insect vectors. Once the bacteria settle in the stigma, they proliferate up to 107 cells per flower within several days under favorable temperatures. Successful infection occurs when the bacteria penetrate the inner tissue of the flower through nectarthodes located beneath the hypanthial surface, and droplets produced by rain or strong dew aid in pathogen migration (Hattingh et al., 1986; Thomson, 1986, 2000). Prevention of flower infections is important for controlling fire blight because pathogens settled in the stigma serve as secondary sources of infection transported via insect pollinators, rains, or winds to nearby flowers, young leaves, and young fruits (Schroth et al., 1974; van der Zwet and Beer, 1999).
The Maryblyt model (MARYBLYT) (Lightner and Steiner, 1993; Steiner, 1990a, 1990b; Steiner and Lightner, 1996) was developed using fire blight data obtained from the eastern regions of the United States (Indiana, Maine, Massachusetts, Michigan, and Ohio), which exhibit similar climate patterns to Korea (Turechek and Biggs, 2015). To run MARYBLYT, the timing of phenological changes are needed, such as when 50% of green tip sprouts (GT), first blossom (B1), and petal fall (PF) of apple trees occur. The output results of the model predict the dates for blossom infection risks (BIR) during the flowering period, in addition to predicting when blossom blight symptoms (BBS), canker margin symptoms (CMS), canker blight symptoms (CBS), shoot blight symptoms (SBS), and trauma blight symptoms (TBS) will appear. The BIR helps determine the appropriate period for spraying agricultural antibiotics during the flowering period, and the expected dates of appearance of BBS, CMS, CBS, SBS, and TBS are used to determine the monitoring time of fire blight symptoms in the field.
In addition to MARYBLYT, there are several models for calculating the timing of fire blight control. According to Billing (1980), the flowering period of apple trees and their corresponding weather conditions vary depending on the region. To effectively utilize the previously developed fire blight prediction models in a specific region, sufficient verification of models developed in areas with similar climate conditions to the region in question needs to be conducted. A model developed in California has been used to determine the first appropriate chemical control time for preventing fire blights when daily average temperatures of 16.7°C, 15.6°C, and 14.4°C are reached in March, April, and May, respectively (Thompson et al., 1982). Spraying of antibiotics such as streptomycin is recommended at intervals of 3 to 5 days until all the flowers have fallen. The state of Washington in the United States utilizes Cougar-Blight as the optimal model for determining the chemical control time, and this prediction model recommends an additional continuous chemical controls for 1-2 weeks after flowers have fallen to prevent the infection of any flowers that bloom after the initial flowering period. In contrast, to the best of our knowledge, Korea has not been previously exposed to fire blight pathogens; therefore, the methods of apple cultivation have not considered fire blight infections. For example, the center of the flower is left intact, while flowers or fruits surrounding the center are picked off to produce larger fruits. In addition, prevention measures are not recommended during the flowering period, as spraying chemicals can affect fruit bearing (Ham et al., 2020).
To calculate the BIR during the flowering period and consequently determine the chemical control timing for the prevention of flower infections, this study employed MARYBLYT and weather data collected from weather stations located in Chungju, Jecheon, and Eumseong in Chungcheongbuk-do, which are the areas that experienced the worst damage from fire blight in apple trees from 2015 to 2020. In addition, we compared the actual date of detection of fire blight symptoms and the predicted dates of appearance of BBS and CBS provided by MARYBLYT to evaluate the feasibility of the model as an informative source in deciding on-site monitoring times.
Materials and Methods
Collection of weather data
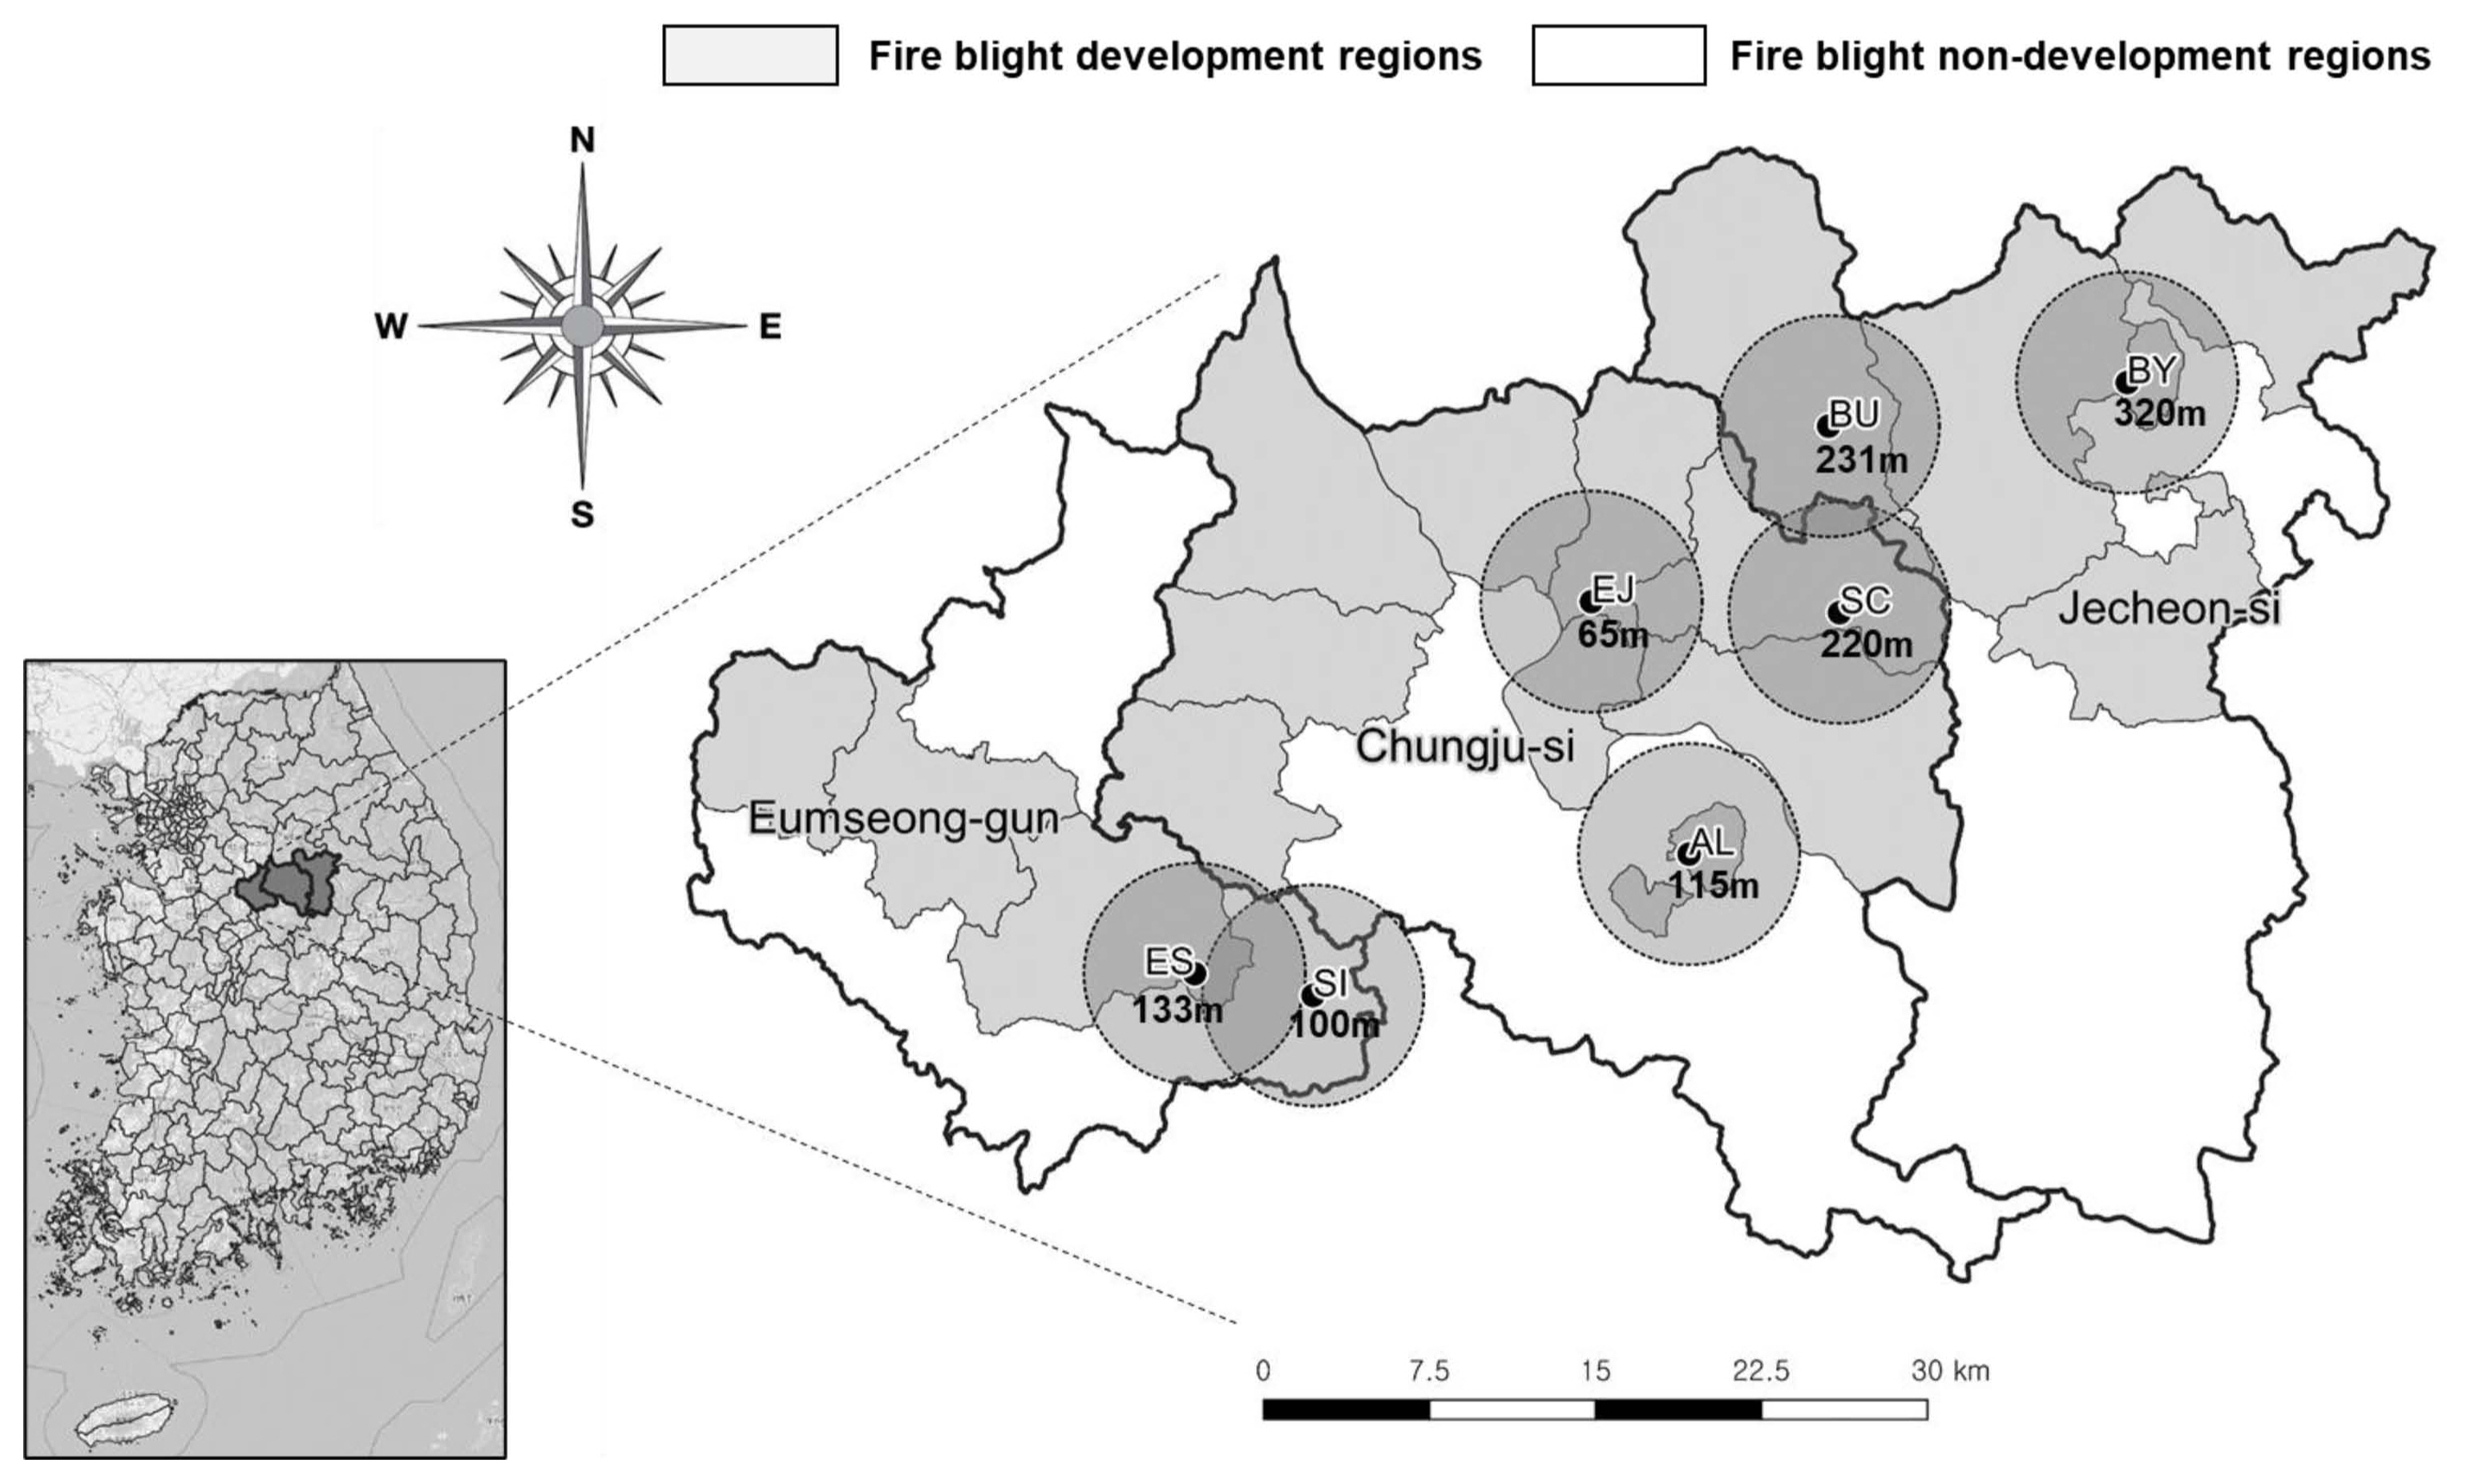
Data from 2015-2020, when fire blight damage was the most severe, were collected by automated weather stations installed in the cities of Chungju, Jecheon, and Eumseong in Chungcheongbuk-do. Phenological changes such as green tip sprouting, start of flowering, and falling dates of apple trees are required to run MARYBLYT. To calculate these phenology dates, daily high and low temperatures were collected from October 1 of the previous year to May 31 of the year in question. The average of the highest and lowest temperatures for each day was used as the daily average temperature. To run the Maryblyt model, the highest and lowest daily temperatures and daily cumulative precipitation data from March 1 to June 30 of the year were entered. Meteorological records were collected using OpenAPI from the automatic synoptic observing system and automatic weather observation system of the open MET data portal (https://data.kma.go.kr), as well as the automatic agricultural weather system of the Rural Development Administration Agricultural Weather 365 (http://weather.rda.go.kr).
Estimation of apple phenology at each observation site
A chill-day model was used to estimate the date of the green tip 50% (GT) sprouting, the first day of bloom (B1), the date of full bloom (FB), and the last day of PF. The date of FB is not necessary to run MARYBLYT, but it is necessary to compare the blossom infection rates before and after FB. The chill-day model is as follows: when the leaves of the temperate apple tree fall, the chill-day (Cd) starts and accumulates until the Cd meets the low-temperature requirement, at which point the endogenous dormancy is disrupted. The chill-day model determines the day when the cumulative anti-chill day (Ca) meets the high-temperature requirements for each growth stage (Cesaraccio et al., 2004).
Using videos taken every hour by the Fruit Growth and Quality Management System (http://fruit.nihhs.go.kr) for 2 years from 2019 to 2020, we visually determined the date of GT sprouting (BBCH scale 07), B1 (BBCH scale 61), FB (BBCH scale 68), and the last day of PF (BBCH scale 69). The date of GT sprouting was collected based on when 50% of the tissue appeared green on 10% of the leaf buds, B1 on when one or more flowers had fully bloomed in the video, BF on when 70% of the flowers in the video had fully bloomed, and the last day of PF on when more than 95% of flower petals fell in the video. Using the highest and lowest daily temperatures observed in the same apple orchard where the videos were taken from October 1, 2018, to May 31, 2020, the Ca value was calculated when the Cd value reached a value of −100.5 degree days (DD) according to the phenological estimation method proposed by Kim et al. (2009).
We utilized the Ca from the apple orchard in Sancheokmyeon, Chungju, Chungcheongbuk-do for further analysis. The Ca value for the date of GT and FB was the lower Ca value of either 2019 or 2020, while the Ca value for FB was selected to be the average Ca value of the 2 years. The last day of PF was determined by analyzing the video data of nationwide apple production sites filmed by the Fruit Growth and Quality Management System to calculate the number of days from FB to PF for each branch, and then adding to the average FB. The determination criteria set for each growth stage were applied to other weather stations in Chungju, Jecheon, and Eumseong to estimate the growth stages in the respective areas.
Running the MARYBLYT model
The Maryblyt 7.1 model (Turechek and Biggs, 2015) program developed in Maryland in the United States was used to predict the proper timing for chemical control to prevent flower infections during the flowering period and to predict the date of appearance of blight symptoms. The model was operated in the cities of Chungju, Jecheon, and Eumseong in Chungcheongbuk-do from March 1 to June 30; the daily cumulative precipitation, and the dates of GT sprouting and B1, as well as the last day of PF were calculated using the phenological prediction model.
The BIR is calculated in MARYBLYT by entering weather elements as well as GT, B1, and PF dates. The output results are displayed in the ‘BHWTR’ column. The ‘+’ symbol refers to when each condition is satisfied, and the ‘−’ symbol refers to when it is not: the flowers have blossomed (B), 110 degree hours [DH] ≥ 18.3°C which means the hourly temperatures at ≥18.3°C (H, 1 DH refers to when the hourly temperature is 1°C higher than 18.3°C), more than 2.5 mm of precipitation occurred on the previous day or more than 0.25 mm of precipitation occurred on the expected day (W), and the average daily temperature was higher than 15.6°C (T). The level of BIR is determined by the number of ‘+’ ratings, with 1 corresponding to low (L), 2 to moderate (M), 3 to high (H), and 4 to infection (I). The BIRs were evaluated daily during the flowering period.
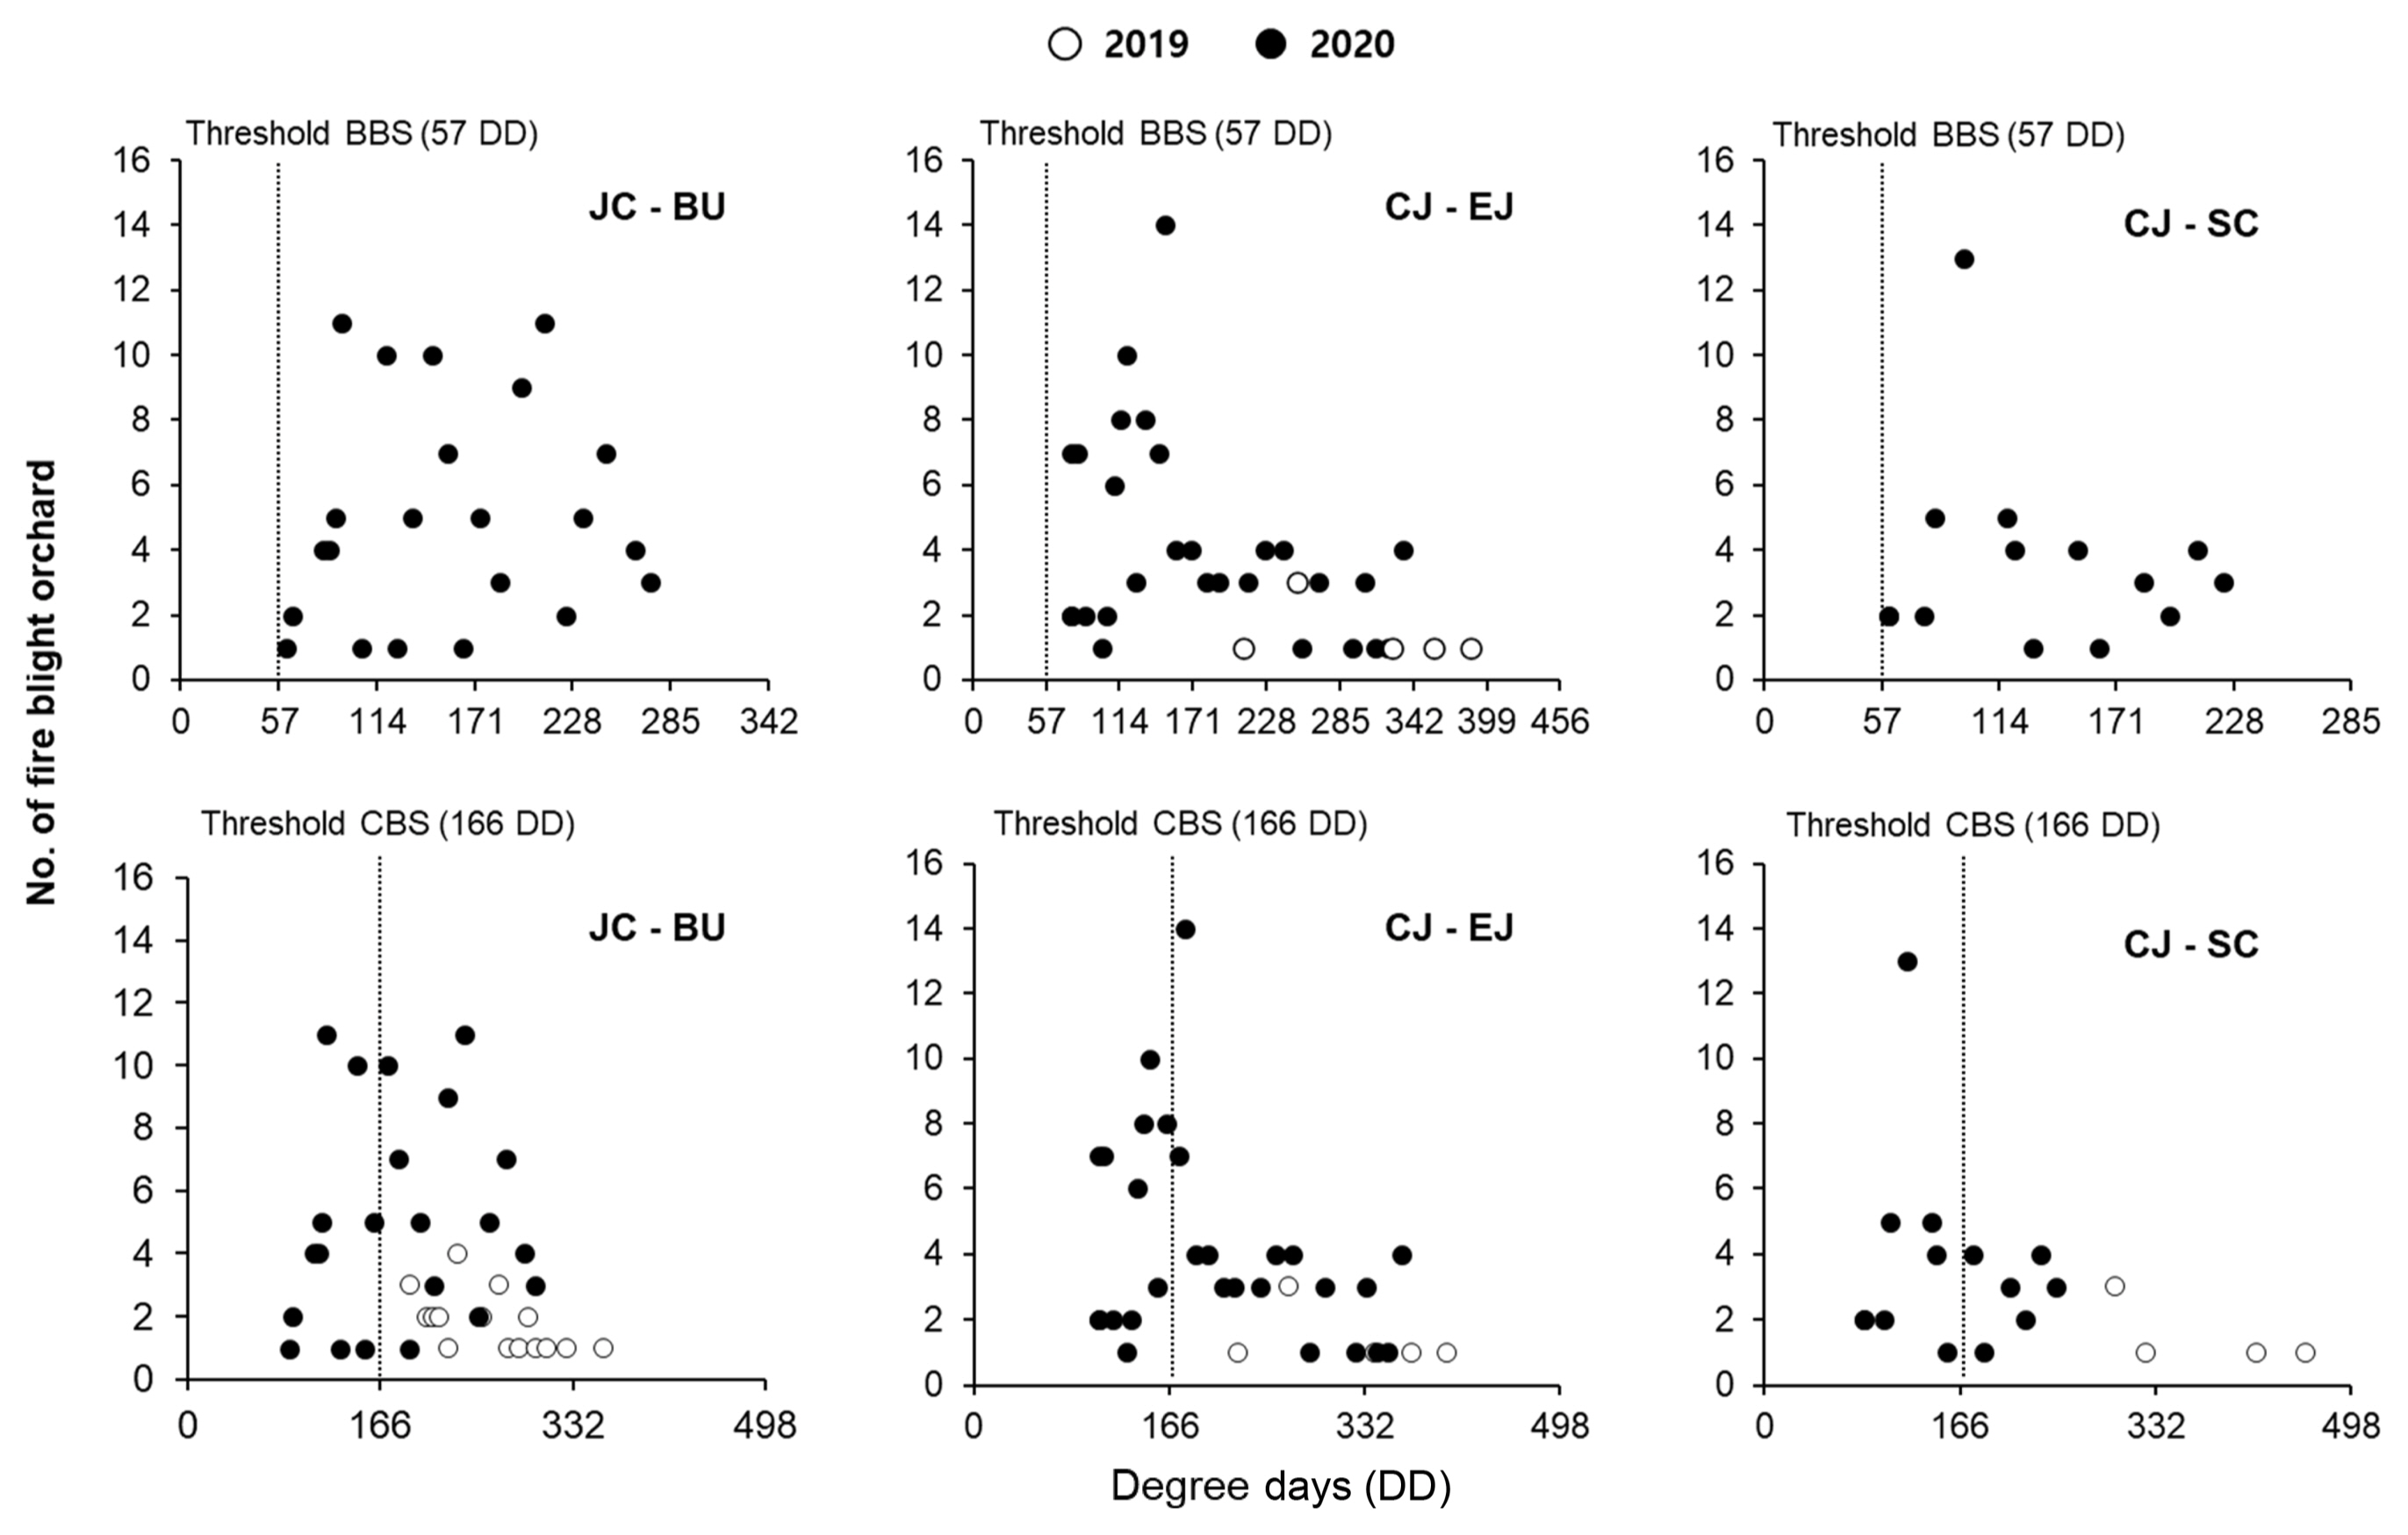
The date of appearance of BBS is predicted to be when the cumulative daily average temperature reaches 57 DD (57 DD ≥ 12.7°C) from the date when the BIR is ‘BIR-I’. The DD is calculated by accumulating the daily average temperatures after subtracting 12.7°C from the average temperature. The day when E. amylovora starts to be active at the edges of the canker, also known as the CMS, is considered to be the date when 109 DD ≥ 12.7°C from the date of GT sprouting. The date of the appearance of CBS is calculated by adding the number of days it will take to reach an additional 57 DD ≥ 12.7°C.
Evaluation of results obtained from MARYBLYT
The distance between the infected orchard and the weather station was calculated using the ‘Geosphere’ package in R software version 4.1.1 (The R Foundation, 2021) in the cities of Chungju, Jecheon, and Eumseong in Chungcheongbuk-do. The appearance dates of BBS and CBS were predicted by MARYBLYT for the observation sites in Eomjeong-myeon and Sancheok-myeon in Chungju city and Baegun-myeon in Jecheon City, where there were the greatest number of infected orchards within a 5 km radius from the automated weather station. The predicted dates of BBS and CBS were compared with the date when blights were first discovered on the farm. In addition, we calculated two DD; the one DD was from the first day of ‘Infection’ warning to the day of the first blossom symptom occurring, whereas the other DD was from the GT day to the day CBS was discovered. The DD that we recalculated were compared with the standard DD thresholds of MARYBLYT to evaluate its application potential in more accurately determining symptom appearance dates.
Blossom infection risks in major apple cultivation areas in Korea
From 2019-2020, MARYBLYT was run to assess the risks of fire blight infection in flowers in major apple cultivation areas in Korea. Data on the growth stages and weather conditions of the apple cultivation areas were obtained from the Fruit Growth and Quality Management System of the National Institute of Horticultural and Herbal Science from the Rural Development Administration. The growth stages of apple trees were visually inspected through video images taken daily, and used to determine the B1 and last day of PF. The number of times the blossom infection risk was at the “Infection level during the flowering period was obtained from the Maryblyt model.
Results
Estimation of apple phenology
The Fruit Growth and Quality Management System observed video images that were taken every day in the apple orchard located in Sancheok-myeon, Chungju city, Chungcheongbuk-do (37°4′22.20132″N, 128°0′26.00064″E; 214.8 m above sea level). From the video images, the date of GT sprouting, B1, and FB were determined. The GT sprouting date for 2019 was April 7, with a calculation of 168.5 DD, and that for 2020 was March 30 with 140.3 DD. The date of B1 for 2019 was April 28 with 317.4 DD, and that for 2020 was April 25 with 268.3 DD. The FB date for 2019 was May 1, with 341.5 DD, and that for 2020 was May 2 with 331.3 DD (Table 1).
Based on the observed GT, B1, and PF dates, the cumulative high-temperature requirements were parameterized from the chill-day model. Accounting for the prediction error of the chill-day model of the growth stage, the reference dates of GT and B1 were set to the lowest value recorded for the 2 years, while the FB dates for the 2 years were the average of the 2 years set as the references for other locations. By observing video images of major apple cultivation areas in Korea, the average number of days between FB and PF was 10 days; therefore, this average was applied to all FB days to determine the day of PF. Using the established references in Table 2, the phenology of apple trees was estimated for the other observation sites.
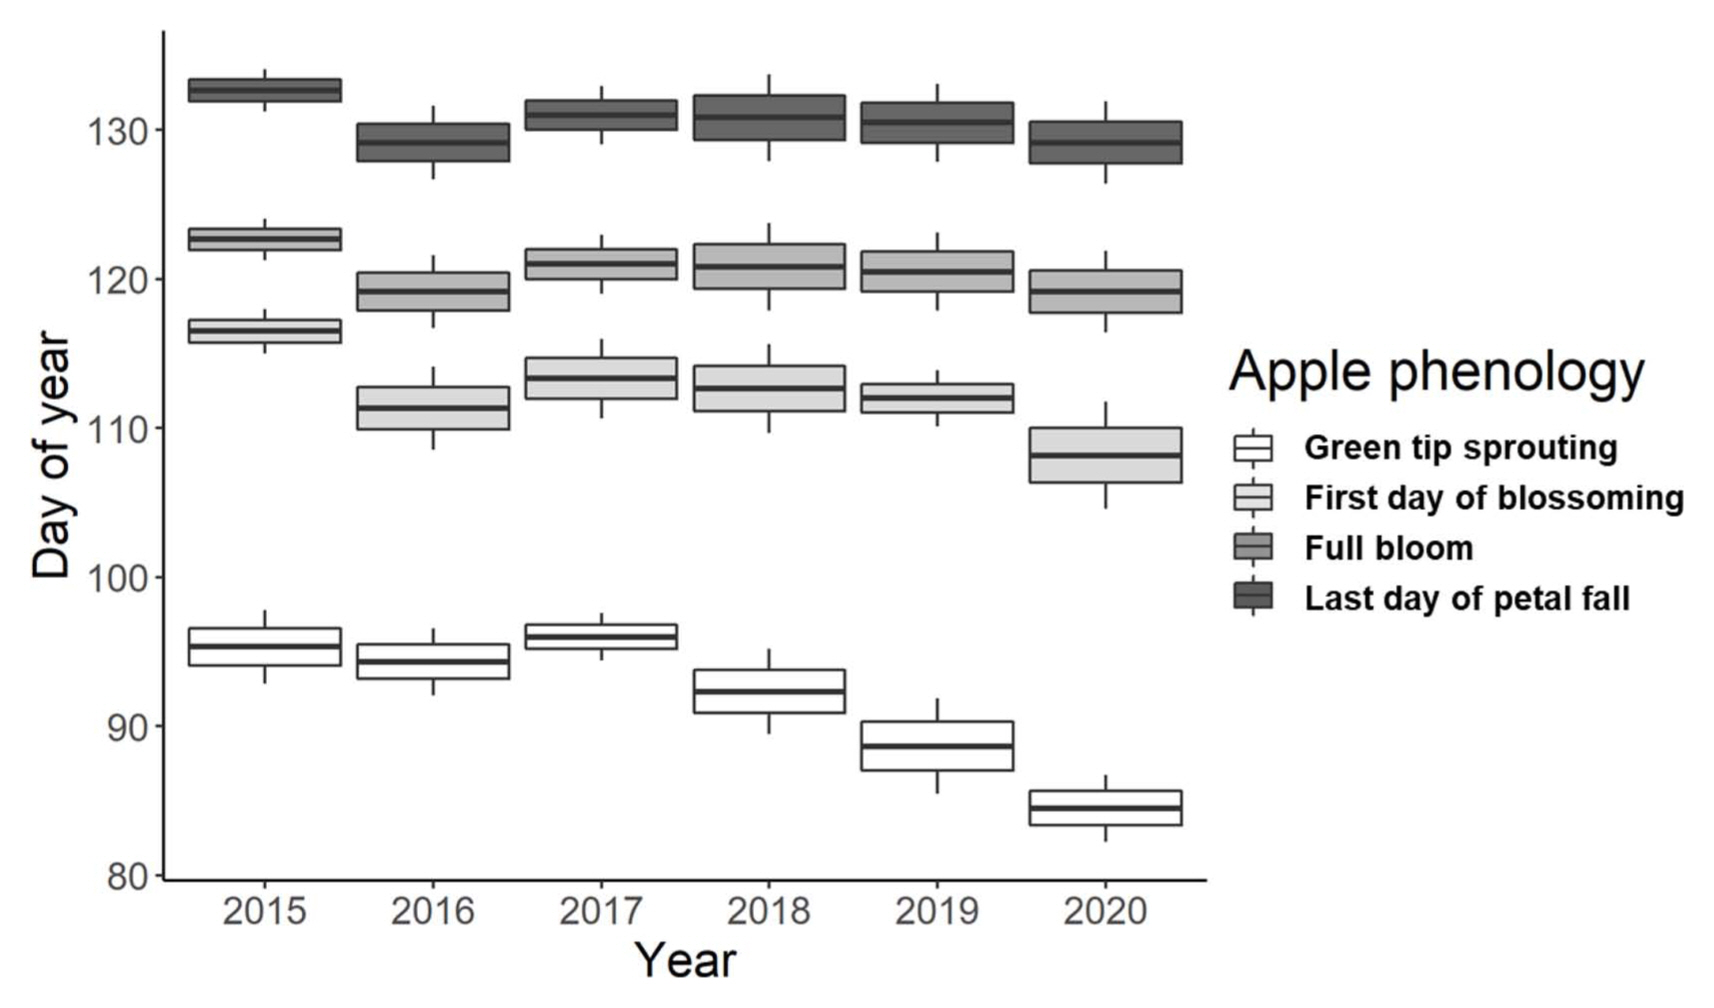
Accumulating DD started on the day of GT to predict the date of CMS appearance in the Maryblyt model, and B1 to PF was the period of BIR. We compared the estimated dates of GT, B1, FB, and PF from 2015 to 2020 (Figs. 1, 2, 4 and 5) and for each station (Fig. 3). The average dates of GT and B1 were the earliest in 2020 among the 6 years, which were 10 days and 9 days earlier than those in 2015, respectively. The dates of FB and PF were also the earliest in 2020. Although 2015 had the latest dates, there was only a 4-day difference from those of 2020, meaning that the flowering period of 2020 was the longest with an average of 21 days, and the flowering period in 2015 was an average of 16 days, which was 5 days shorter than 2020 (Fig. 2).
From 2015 to 2017, the Anlim site in Chungju began to exhibit the earliest blossoming time, and in the following years, the earliest blossoming time appeared at the Soi site in Eumseong. The smallest range in B1 among the six sites was 5 days in 2015, and the largest range was 13 days in 2020 (Fig. 3).
Estimation of blossom infection risk on apple and number of controls using MARYBLYT
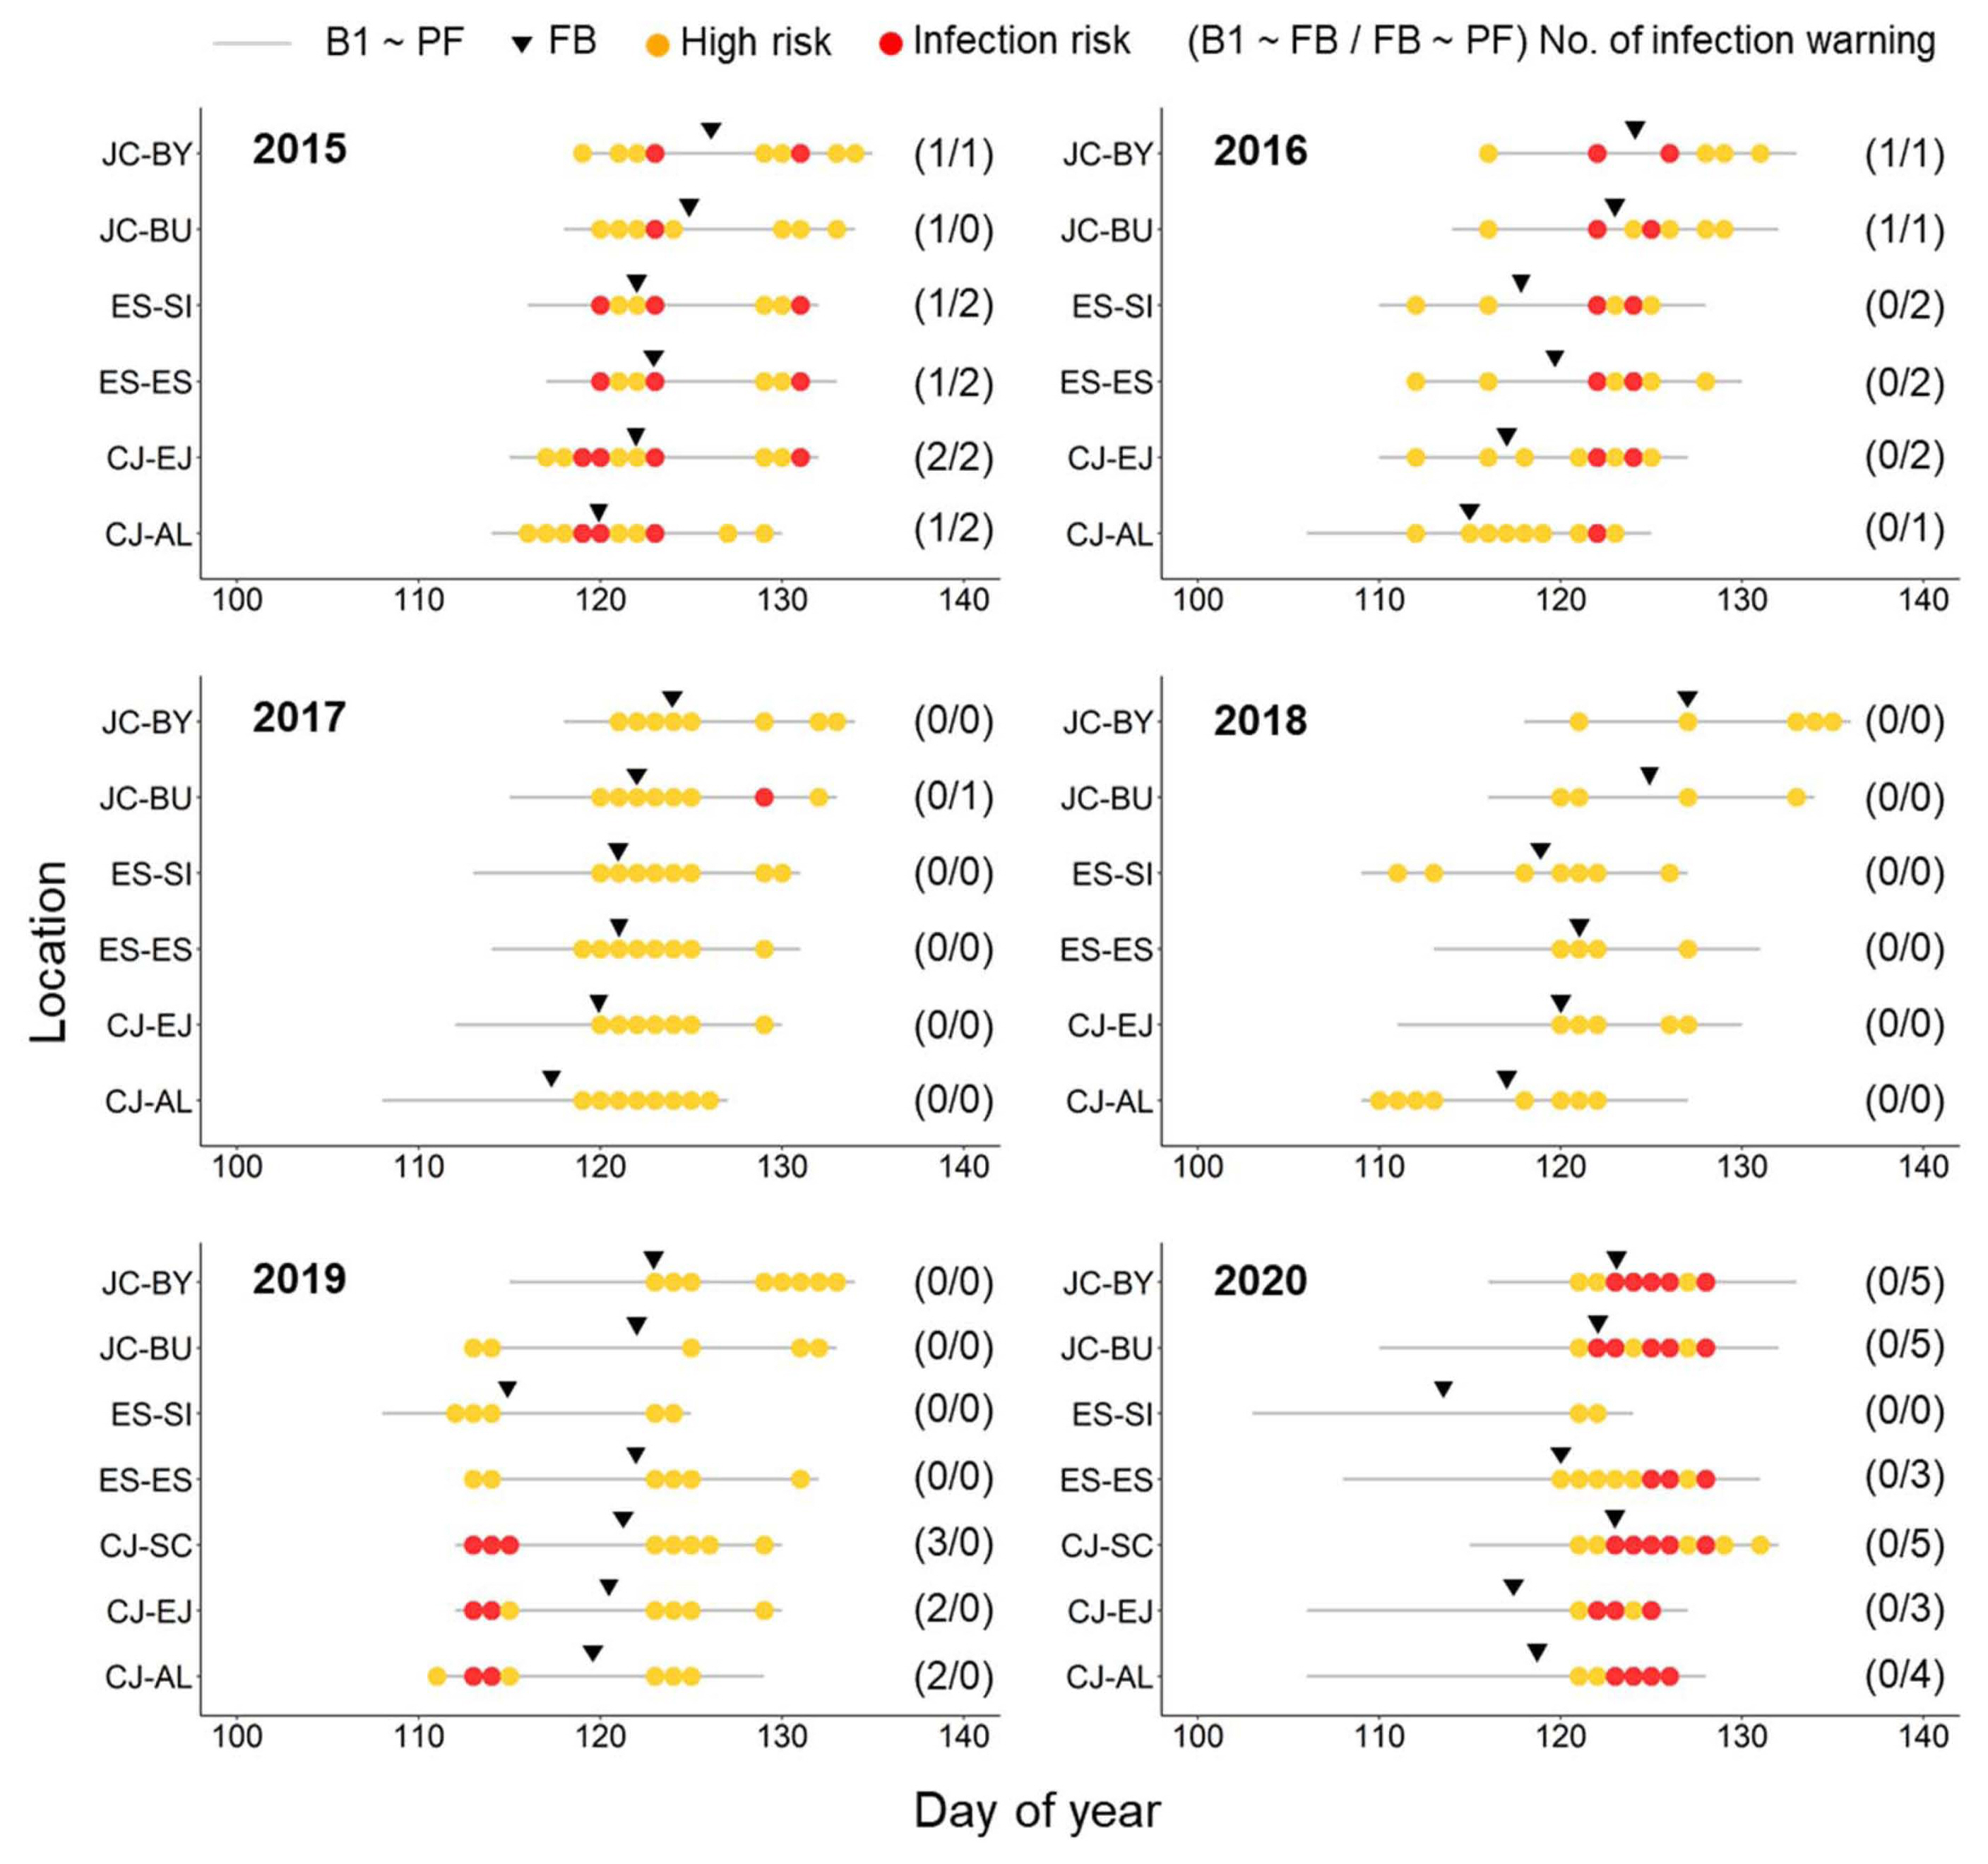
From 2015 to 2020, MARYBLYT was run during the flowering period to find the BIR-High and -Infection warnings, and the number of BIR-Infection alerts was compared before and after FB (Table 3, Fig. 3). The first BIR-Infection alerts appeared in Eomjeong and Anlim in Chungju on April 29 and May 3, 2015, respectively, and BIR-Infection alerts appeared at all six sites in the three cities. The BIR-Infection alerts appeared one to four times in 2016, and simultaneously on May 2, 2016 at all six sites. Anrim had one BIR-Infection alert, whereas the other sites had two. In 2017, only Baegun in Jecheon exhibited a BIR-Infection alert, and no infection alerts appeared in 2018. Two to three alerts appeared only at the Chungju-si sites in 2019. In 2020, there were three to five BIR-Infection alerts at all sites except Soi for a 7-day period from May 2 to May 9.
The number of BIR-Infection alerts and the number of agricultural antibiotic applications were calculated for two periods: before and after FB (Fig. 3). In 2015, BIR-Infection alerts appeared both before and after the FB. The recommended number of times to spray antibiotics was once both before and after FB, bringing the total to two for the entire flowering period. In 2016, the BIR-Infection alerts occurred once before and after FB at the Bongyang and Baegun sites in Jecheon, but the number of antibiotic sprays was determined to be just once considering the 5-day (reference) duration of medicinal effects. At other observation sites, BIR-Infection appeared only after FB, and the recommended date to spray was determined to be May 2, which was the same date for the Bongyang and Baegun sites. In 2017, BIR-Infection alerts were only given at the Baegun site in Jecheon after FB, so only one session of spraying was recommended. In 2018, there were no BIR-Infection alerts both before and after FB, so the spraying of antibiotics was not recommended. In 2019, there were BIR-Infection alerts before FB. And all of the BIR-Infection alerts in 2020 were after FB. Therefore, it is necessary to spray agricultural antibiotics recommended on the model alerts which had been varied depending on the seasons.
Prediction of blight appearance date according to MARYBLYT
MARYBLYT was able to predict the expected appearance dates of BBS and CBS in 2019-2020 at Eomjeong and Sancheok in Chungju and Baegun in Jecheon, where severe fire blight symptoms appeared in apple orchards within a 5 km radius of the weather stations (Table 3). The expected appearance date of the first BBS in 2019 was May 10 at Eomjeong and Sancheok in Chungju. Meanwhile, the expected appearance date of BBS in Jecheon was not calculated because there were no BIR-Infection warnings. The expected appearance dates of CBS were May 21, May 19, and May 24 for Eomjeong, Sancheok, and Baegun, respectively. In 2020, the expected appearance date of BBS was May 15 for Eomjeong and May 17 for Baegun. The expected appearance dates of CBS were May 23 May 31, and May 30 for Eomjeong, Sancheok, and Baegun, respectively (Table 3).
The model’s prediction dates for BBS and CBS were compared with the dates when blights were first discovered in the apple orchards. The first reported date of blight discovery in 2019 was about a month later than the BBS expected date by MARYBLYT at Eomjeong (June 10, 2019), Sancheok (June 7, 2019), and Baegun (May 29, 2019). Baegun in Jecheon had severe fire blight damage and showed only 5 days difference between the CBS date predicted by the model (May 24, 2019) and the first discovered date of fire blight, which was the smallest difference among the three observation points. In 2020, when the number of apple orchards that had fire blight symptoms dramatically increased, the first signs of blight were reported only 1 day later than the predicted BBS dates for Sancheok (May 18, 2020) and Baegun (May 18, 2020), and 3 days later for Eomjeong (May 18, 2020) (Table 3). In 2020, the incidence of flower blight was visually confirmed in Sancheok and Baegun.
Environmental analysis of apple blossom infections during the flowering period
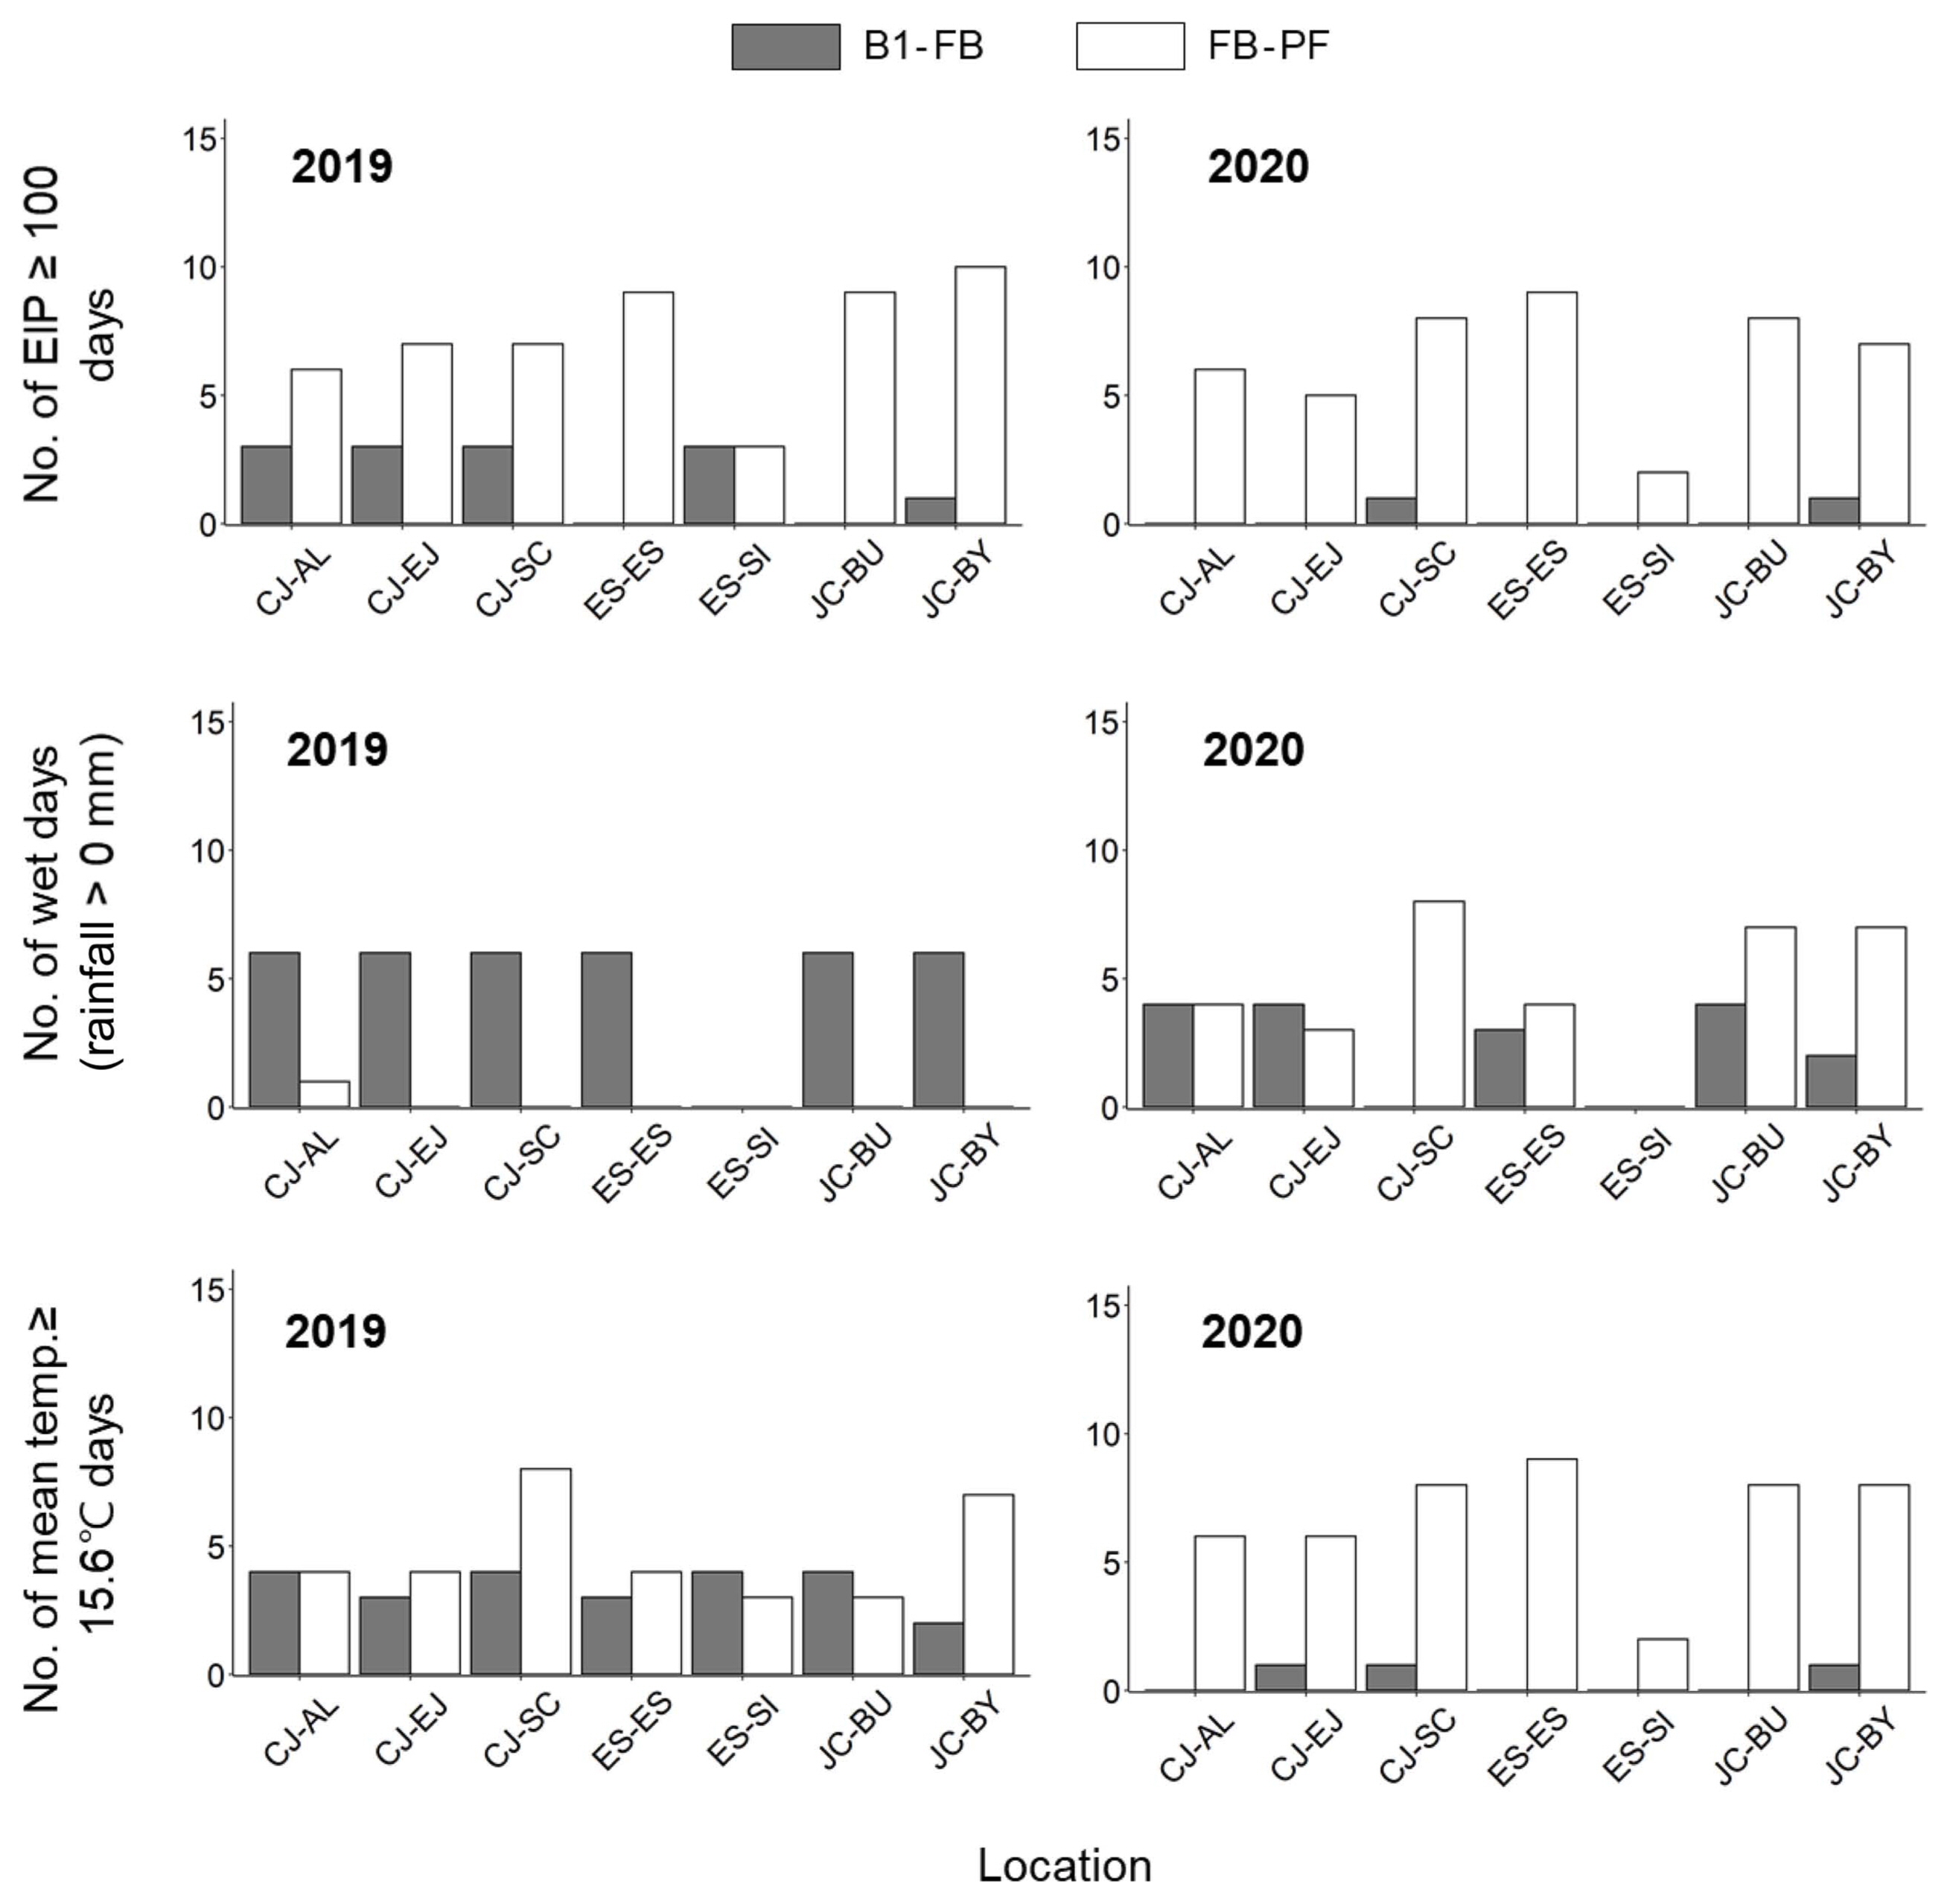
The three climatic conditions required to calculate the blossom infection risk in the Maryblyt model during the flowering period include: (1) the number of days when epiphytic infection potential (EIP) exceeds 100%, (2) the number of days when the average temperature is above 15.6°C, and (3) the number of rainy days. To evaluate the risk of infection before and after FB during the blossom period, the number of days that satisfied each climate condition was resolved the three climatic conditions before and after FB in 2019 and 2020. In 2019, rainfall commonly occurred before FB, while it only rained for a single day at Anlim in Chungju after FB, and there were also no rainy days in the other regions during this period. The number of daily average temperatures exceeding 15.6°C was quite similar between before and after FB in 2019. In 2020, the three climatic conditions were drastically different from 2019. The number of days when the EIP exceeded 100% and the number of days when daily average temperatures exceeded 15.6°C was significantly lower before FB in 2020 compared to those in 2019 due to the low temperature during blossoming. Overall, more favorable environmental conditions for flower infections were demonstrated in the period before FB in 2019, and the period after FB in 2020.
Analysis of blossom infection risk in major apple cultivation areas in Korea
Using weather data and growth monitoring video data observed in the major apple cultivation areas in Korea, we calculated the BIR during the flowering period in 2019 and 2020 using the Maryblyt model (Table 4). Blossom infection risks were identified as BIR-Infection alerts. Two alerts appeared on April 23 and April 24 in the city of Yeongju and the county of Gunwi in Gyeongsangbuk-do, and one alert occurred on April 24 in the county of Gochang. There were no BIR-Infection alerts in the county of Cheongsong in Gyeongsangbuk-do or the county of Jangsu in Jeollabuk-do. During the apple tree flowering period in 2020, 1-3 BIR-Infection alerts were mainly issued from May 3 to May 6. No cases of orchards with fire blight symptoms had been reported in Pocheon, Hwaseong, Yeongju, Gunwi, Cheongsong, Geochang, and Jangsu until 2020.
Discussion
According to the results obtained from the Maryblyt model for 2015 to 2020, the number of BIR-Infection alerts was the highest in 2020 and the lowest in 2017 and 2018. The order of BIR-Infection alerts from the highest to lowest was 2020, 2015, 2019, 2016, 2017, and 2018. In particular, BIR-Infection alerts were intensively displayed in 2020 due to frequent rainfall and rapid temperature fluctuations from the day of FB during the flowering period of apple trees, implementing favorable conditions for infection. A blight symptom appeared in the observed flowers within 3 days of the predicted BBS appearance by the Maryblyt model.
Apple trees in the orchards with fire blight symptoms are buried, and three stages of prevention control strategies are provided according to the standards established by the Rural Development Administration. The first stage of control is conducted before the flowering period in all cultivation areas of apple and pear trees nationwide and involves spraying the registered copper mixture on pear trees before flower buds sprout and on apple trees before new branches begin to appear. Once flowering has been initiated, the second control is recommended in occurrence and special control areas and involves spraying the registered chemicals 5 days after FB. The final control is recommended 10 days after the second chemical prevention control. However, according to the model’s infection results in this study, BIR-Infection alerts were issued even before the FB period. In 2019, the Maryblyt model showed that BIR-Infection alerts were predominantly issued 2-3 days from the beginning of the flowering period. In addition, the largest difference between orchards in the same city or county in growth stage periods, such as B1 and PF, was shown to be approximately a week. If the application time of fire blight control was determined based on a specific growth stage, the date of chemical spraying would vary from orchard to orchard, depending on the growth stage. However, the common feature of the Maryblyt BIR during the flowering period was that the time of BIR-High or BIR-Infection alerts was the same regardless of location. The characteristics of weather factors, such as spatial continuity and precipitation range, determine the infection of flowers. In other words, registered chemicals should be sprayed over a wider area at the same time.
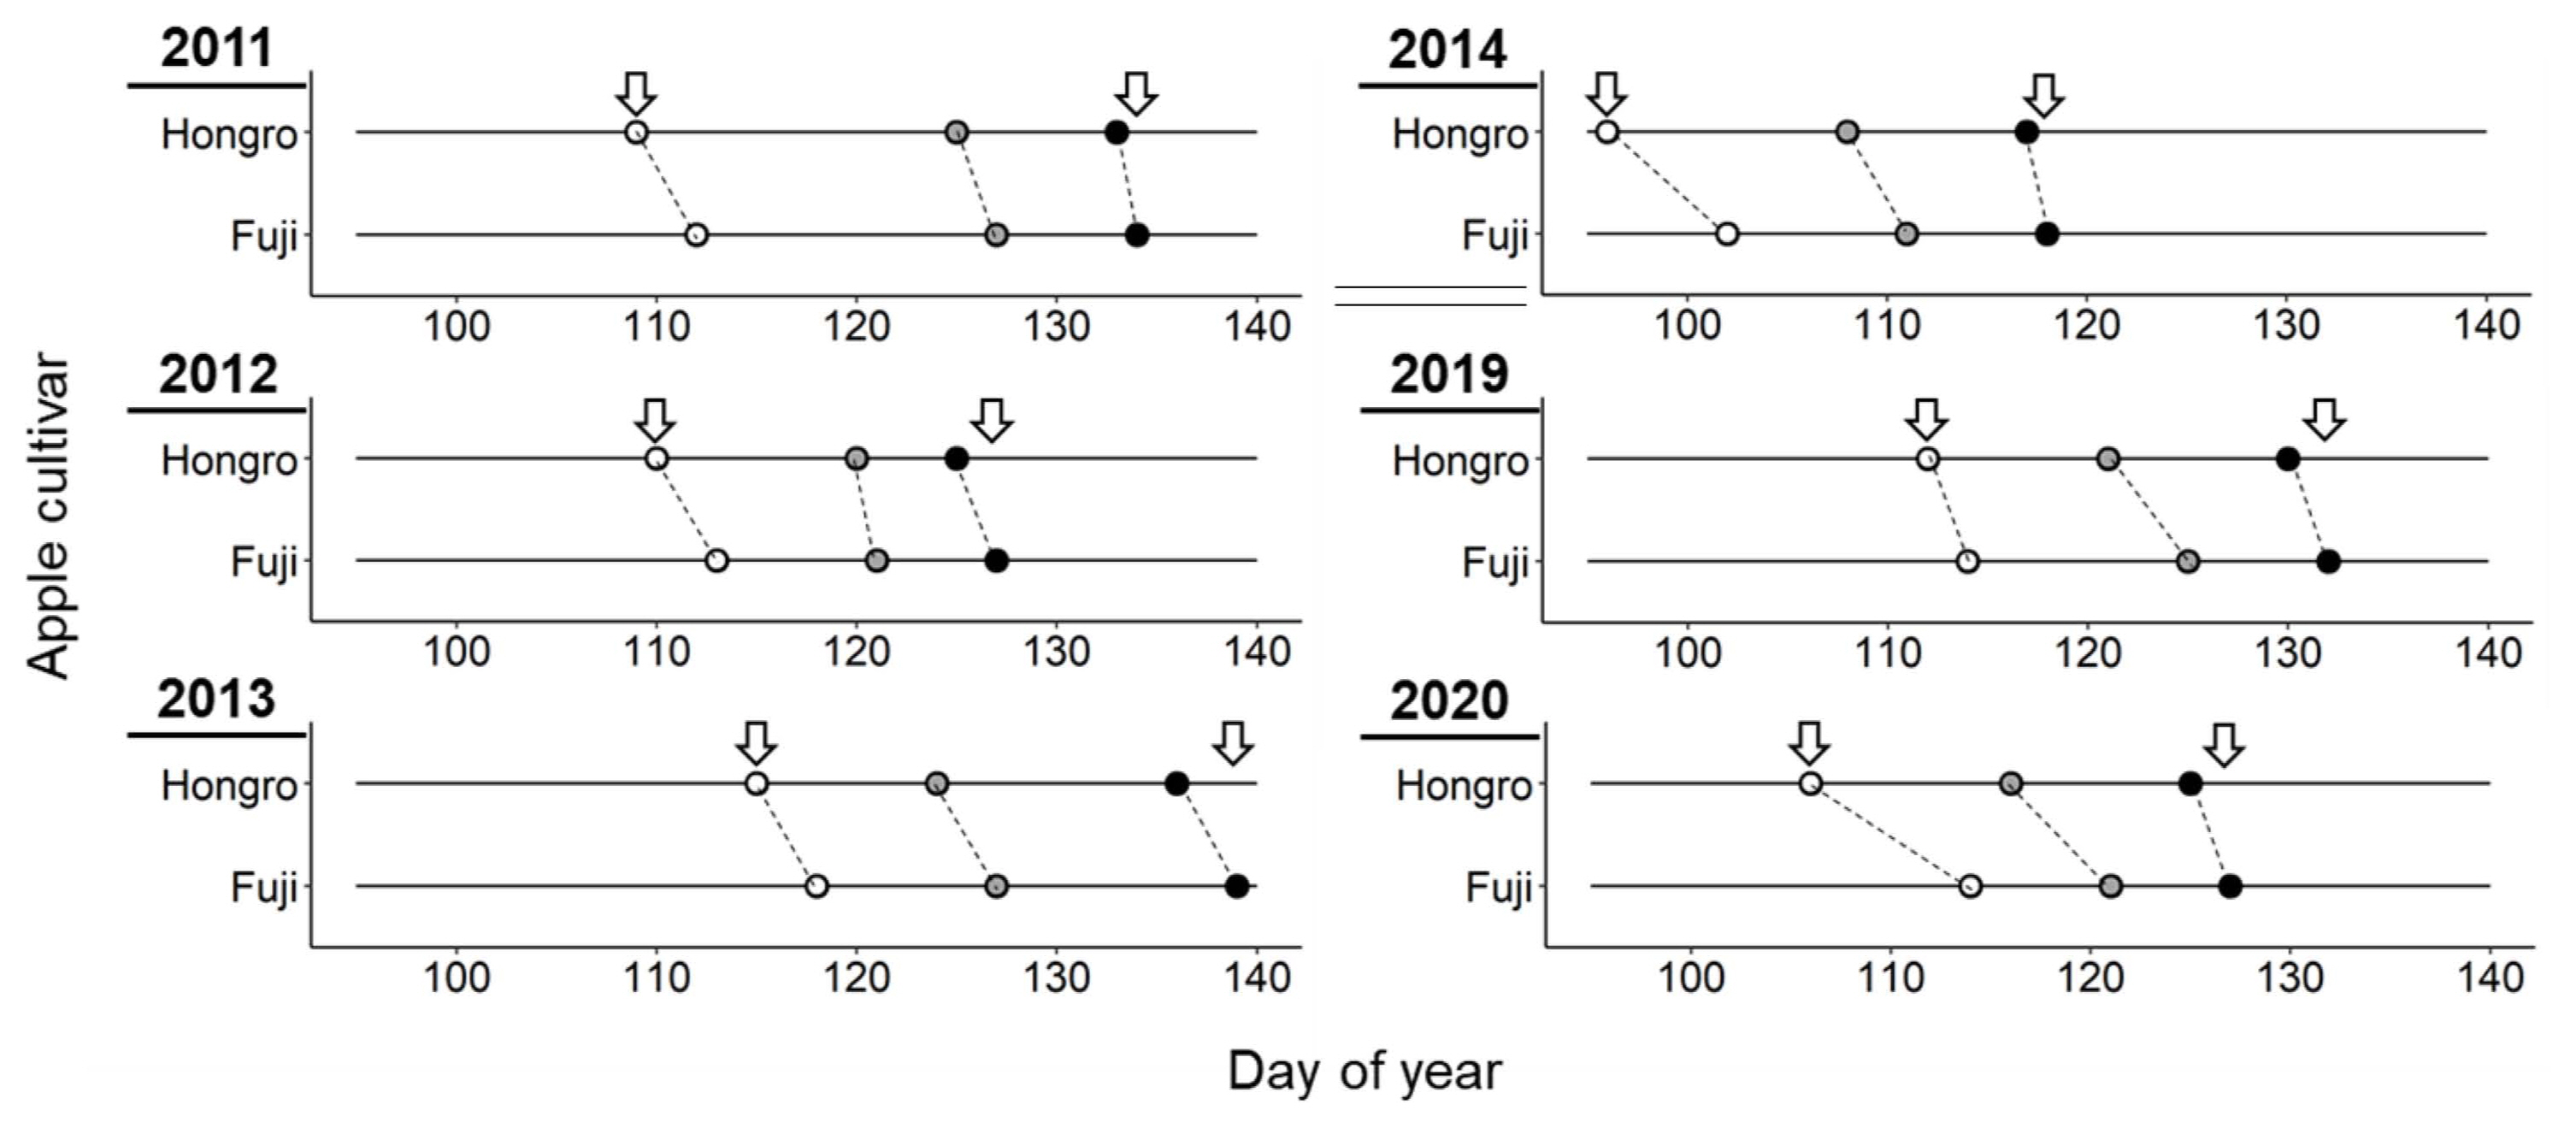
To predict the risk of blossom infection during the flowering period using fire blight prediction models such as Maryblyt and CougarBlight, we should consider the flowering periods depending on the variety of apple trees. Fuji variety account for 76% and Hongro variety account for 15% of Korean orchards (Choi et al., 2018). Most orchards grow multiple varieties, rather than a single variety. According to a study on the growth stages of Fuji and Hongro apples cultivated simultaneously in a single orchard at Janghowon, Icheon-si, Gyeonggi-do from 2011-2014 and 2019-2020, Hongro began to bloom 4 days earlier on average compared to Fuji, and the period of PF was also earlier by 2 days. It was found that if both the Fuji and Hongro varieties were cultivated simultaneously in a single orchard, their flowering periods were longer by 5 and 2 days compared to those in orchards that cultivated either only Fuji or Hongro, respectively (Fig. 6). As cultivating Fuji and Hongro together increases the flowering period, there will be more opportunities for flower infections by E. amylovora, meaning that infected flowers of the Hongro that blossomed earlier can act as major sources of secondary infection for the Fuji.
In addition to spraying chemicals at the appropriate times to prevent flower infections, another important prevention strategy is to reduce the primary sources of infection in the orchard by finding and removing cankers during the winter (Schroth et al., 1974). This also includes the premature detection and removal of infected flowers and blights caused by cankers that are active during dormancy. The Maryblyt model can predict when these blights would start to develop and when they will be visually detectable. In 2019, there was a 5-day difference between the date of CBS and the date of the discovery of the first blight in Baegun, Jecheon-si, where there was the highest number of apple orchards infected by fire blight. In 2020, when severe cases of fire blight occurred, there was a 1-day difference between the date of BBS and the date of the discovery of the first flower blight within the area. However, the difference between the expected appearance date of the blight predicted by the Maryblyt model and the date of the discovery of the first blight in the 2 years was not significant. Based on the results showing that there was no significant difference between the expected appearance date of BBS and the date of the actual discovery of flower blight, we can surmise that the period of flower infection should be identical to the time of the first BIR-Infection alert. In addition, the more severe the incidence of fire blight, the smaller the difference in days between the expected appearance date of blights predicted by the Maryblyt model and the date of blight discovery.
Billing (1980) compared various fire blight prediction systems in several regions (Sacramento, California; Rochester, New York; Vlissingen, southwestern Netherlands; and Faversham, Kent, England). Systems that use a single threshold show statistically unreliable results in areas that exhibit different weather conditions during the flowering period. For example, the average temperature threshold of the Thomson model cannot effectively predict the risk of fire blight infection in flowers during the flowering period in regions with a low range of daily temperature changes. Furthermore, models using only climate factors to determine a blossom infection have been shown to produce more valid results in California, where there is little rainfall during the flowering period. Therefore, Billing (2007) stated that it is important to identify the limitations of the developed model and to understand the intentions of the researchers who developed the original model when applying a fire blight prediction model to new areas that have never been affected by fire blight. It is important to collect data on disease outbreaks in the field and to continuously improve the disease forecasting model.
For a plant disease outbreak, interactions among the susceptible host plant, the presence of pathogens, and a favorable environment must exist (Agrios, 2005). It is important to predict the period when plant diseases can reach a threshold in which severe economic damage can occur, and prediction models are helpful for determining the appropriate timing to control and effectively combat a disease outbreak (Campbell and Madden, 1990). These models also aim to avoid unnecessary pesticide spraying by providing farmers with the information needed to determine the appropriate time to spray chemicals (Gent et al., 2013). Based on our findings, the Maryblyt model can be considered a useful tool for determining a suitable period for preventing blossom infection of fire blight and monitoring major blight symptoms in areas with severe cases of fire blight. To easily utilize the model in the field with the intention of controlling fire blight, however, a field database on fire blight incidence needs to be established, and efforts should be made to improve the prediction model. In addition, field researchers should discuss methods with experts to actively use the prediction model to formulate prevention strategies.
 PDF Links
 PubReader
 ePub Link
 Full text via DOI
 Full text via PMC
 Download Citation
 Print
Print