Identification of Coupling and Repulsion Phase DNA Marker Associated With an Allele of a Gene Conferring Host Plant Resistance to Pigeonpea sterility mosaic virus (PPSMV) in Pigeonpea (Cajanus cajan L. Millsp.)
Article information
Abstract
Pigeonpea Sterility Mosaic Disease (PSMD) is an important foliar disease caused by Pigeonpea sterility mosaic virus (PPSMV) which is transmitted by eriophyid mites (Aceria cajani Channabasavanna). In present study, a F2 mapping population comprising 325 individuals was developed by crossing PSMD susceptible genotype (Gullyal white) and PSMD resistant genotype (BSMR 736). We identified a set of 32 out of 300 short decamer random DNA markers that showed polymorphism between Gullyal white and BSMR 736 parents. Among them, eleven DNA markers showed polymorphism including coupling and repulsion phase type of polymorphism across the parents. Bulked Segregant Analysis (BSA), revealed that the DNA marker, IABTPPN7, produced a single coupling phase marker (IABTPPN7414) and a repulsion phase marker (IABTPPN7983) co-segregating with PSMD reaction. Screening of 325 F2 population using IABTPPN7 revealed that the repulsion phase marker, IABTPPN7983, was co-segregating with the PSMD responsive SV1 at a distance of 23.9 cM for Bidar PPSMV isolate. On the other hand, the coupling phase marker IABTPPN7414 did not show any linkage with PSMD resistance. Additionally, single marker analysis both IABTPPN7983 (P<0.0001) and IABTPPN 7414 (P<0.0001) recorded a significant association with the PSMD resistance and explained a phenotypic variance of 31 and 36% respectively in F2 population. The repulsion phase marker, IABTPPN7983, could be of use in Marker-Assisted Selection (MAS) in the PPSMV resistance breeding programmes of pigeonpea.
Pigeonpea or Red gram (Cajanus cajan (L.) Millsp.) is an second most important food legume for the tropical and subtropical regions of Indian subcontinent, South-East Asia and East Africa. It is a main protein source (20 to 30 per cent protein) for more than a billion of people in the developing world. In the developing world, protein is often only available at levels less than one-third of minimum dietary requirements (Varshney et al., 2009). It is grown on over 5 million hectares in Asia, South-Central America and sub-Saharan Africa and globally it is the sixth most important legume food crop. Pigeonpea has a diploid genome with 11 pairs of chromosomes (2n=2x=22) and a genome size is 833.07 Mb (Singh et al., 2011; Varshney et al., 2011). India is the largest producer of pigeonpea (2.65 mt) followed by Myanmar (0.90 mt) and Malawi (0.24 mt) (FAOSTAT 2012; http://faostat.fao.org).
Several abiotic such as (low and high moisture, salinity and water-logging hypoxia and biotic such as fusarium wilt, sterility mosaic and several insect pests including pod borer insects, maruca, stresses, are serious challenges for sustainable pigeonpea production to meet the demands of the resource for poor people of several African and Asian countries. Kumar et al. (2000) reported a tenui virus of asymmetric morphology as the cause of sterility mosaic disease and proposed the name of virus as Pigeonpea sterility mosaic virus (PPSMV). PPSMV is flexous, branched filaments measuring 3–8 nm in diameter. It is transmitted by an eriophyid mite (Aceria cajani Channabasavanna). Occurrence of this PPSMV is frequent and spreads rapidly under suitable conditions leading to epidemics. Long life cycle, out crossing nature, difficulty in accurate phenotyping, linkage drag and dynamic nature of the PSMD pathogen are some of the limitations or bottleneck being faced in conventional breeding efforts for PSMD resistance in pigeonpea. Previous studies on PSMD resistance indicated the presence of single gene control (Ganapathy et al., 2009; Murugesan et al., 1997; Srinivas et al., 1997) as well as oligo-genic nature of this trait in pigeonpea (Gnanesh et al., 2011; Nagaraj et al., 2004; Sharma et al., 1984). Similarly, Gnanesh et al. (2011) reported four QTLs for Patancheru PSMD isolate and two QTLs for Bangalore PSMD isolate. Recently, Daspute et al. (2014) revealed two gene (SV1 and SV2) interaction governing resistance against PSMD Bidar isolate in ICP 8863 × BSMR 736 cross. Here in this study, the dominant allele of (SV1) gene has inhibitory action on the trait (resistance) govern by other (SV2) gene.
A variety of DNA based markers such as Random Amplified Polymorphic DNA (RAPD), Restriction Fragment Length Polymorphism (RFLP), Amplified Fragment Length Polymorphism (AFLPs), Simple Sequence Repeat (SSR) and Single Nucleotide Polymorphism (SNP) have been employed for MAS. The RAPDs and SSRs markers are economically inexpensive and easy to use compared to non-PCR based markers like RFLP and AFLPs. Therefore, the use of genetically linked molecular markers could facilitate MAS. In present study, we report the identification of a coupling- and repulsion-phase short decamer random DNA markers genetically associated PSMD resistance genes in pigeonpea.
Materials and Methods
Plant material
A set of 325 F2 individual plants from a cross between highly susceptible genotype (Gullyal white) x resistant genotypes (BSMR 736) were collected from Agricultural Research Station (ARS), Gulbarga, India. The F2 populations along with parents were grown in the field covered with nylon net cages to prevent insect entry and possible cross pollination, at Main Agricultural Research Station (MARS), Dharwad, India. The mature seeds from individual F2 plants harvested or collected to constitute F2:3 families and the same were used for the field evaluation in PSMD sick plot a national facility at ARS, Bidar, India.
Phenotyping of F2:3 families and parents in a sick plot
The disease reaction of the parents and F2:3 families were assessed in the PSMD-sick plot, at ARS, Bidar, India. The PPSMV artificial inoculation in the field was done according to “leaf stapling” and “infector-hedge” techniques (Nene and Reddy, 1976). Individual F2:3 families and the parents were scored for disease incidence. Accordingly, the F2:3 families were classified as resistant (0–10.0 percent of plants infected); moderately resistant (10.1–30.0 percent of plants infected) and susceptible (30.1–100 percent of plants infected) (Singh et al., 2003). The Chi-square (χ2) test was used to test the goodness of fit of the segregating F2:3 families with the expected phenotypic ratios. Based on the observed segregation ratio it was suggestive that the PPSMV resistance is under two gene control with non-allelic interaction of the type ‘inhibitory gene interaction’.
DNA isolation
Leaves collected from all the F2 plants and parents established in MARS, Dharwad, were surface sterilized with 70 percent (%) alcohol and immediately frozen in liquid nitrogen and lyophilized. Freeze-dried leaf samples were ground in liquid nitrogen and total genomic DNA was extracted through CTAB method (Murray and Thompson, 1986) and DNA was further purified from carbohydrates, proteins and RNA before actual use (Sambrook et al., 1989). The DNA concentration was quantified spectrophotometrically.
Bulked segregant analysis
Molecular markers putatively linked to the PSMD resistance genes were identified by using BSA (Michelmore et al., 1991). Two contrasting DNA bulks were made by pooling equal amount of DNA from randomly chosen eight F2 homozygous resistant and eight F2 homozygous susceptible individuals, respectively. DNA samples of resistant and susceptible parents along with resistant and susceptible bulks were screened for polymorphism with short decamer random DNA markers. Individual components of the resistant bulk and resistant parent were also checked against the susceptible bulk and the susceptible parent for the presence or absence of the characteristic amplicon. Primers showing expected segregation in subsets were tested across all F2 plants and the marker data was compared with the field phenotypic data for PSMD resistance.
Short decamer random DNA marker analysis
The decamer random DNA marker reactions were performed in 25 μl volumes in 100 μl PCR tubes (Tarson Pvt Ltd, India). The reaction mixture contained 50 ng of template DNA, 1 × amplification buffer (10 mM of Tris-HCl- pH 8, 50 mM of KCl, 1.8 mM of MgCl2 and 0.01 mg/ml gelatin), 2.5 mM each of dCTP, dGTP, dATP, and dTTP, 5 pM primers and 1U Taq DNA polymerase (Bangalore Genei, Pvt. Ltd., India). The reactions were performed in a Master Cycler Gradient 5331 (Eppendorf version 2.30. 31-09, Germany). The reaction had an initial denaturation step at 94°C for 5 min, followed by 35 cycles of 94°C for 1 min, 33°C for 1 min, 72°C for 2 min. The final extension step was at 72°C for 10 min. The PCR products were separated on 1.5% (w/v) agarose (Sigma-Aldrich, USA) gels at 5 V/cm in 1×TBE (89 mMTris-HCl, 89 mM boric acid and 2 mM EDTA, pH 8.0) buffer. The agarose gels were stained with 1 μg ml−1 ethidium bromide, visualized under UV light and photographed on a digital gel-documentation system. The molecular weights of the short decamer random DNA marker products were estimated with a 100-bp DNA ladder (New England BioLabs, MA, USA).
A set of 300, decamer random DNA primers (Operon Technologies, Almeda, California, UAS) were screened against genomic DNA of parents; Gullyal white and BSMR 736 for their ability to detect polymorphism. The primers, that produced polymorphic amplicons were tested at least two times for reproducibility and only such primers were subjected for BSA analysis. Further, these short listed polymorphic primers were used to screen F2 plants.
Linkage analysis
Chi-square goodness of fit was used to test fit to the expected segregation ratios of short decamer random DNA markers amplicons, within the segregating F2 plants derived from Gullyal white x BSMR 736 cross. Single marker analysis of variance using (single factor–ANOVA) was performed to detect associations between each marker in the segregating F2 individual’s progeny. A significant association was declared if P<0.05. Relative positions and distances between molecular marker loci and PSMD resistance were estimated using the MAPMAKER computer program, version 3.0 (Lander et al., 1987) with a LOD threshold of 3.0. Map distances in cM were estimated with the Kosambi mapping function.
Results
Genetics analysis of PSMD resistance
The inheritance pattern of resistance to PSMD was studied in F2 populations based on segregation ratio of alternative phenotypes (resistant and susceptible). The PSMD phenotyping was not carried out at F2 due to its destructive nature. The seeds were harvested from F2 plants to obtain F2:3 families. A set of 325 F2:3 families of Gullyal white × BSMR 736 were individually evaluated for the incidence of PSMD. Of the 325 F2:3 families field evaluated, 55 showed resistant phenotype, 234 were moderately resistant and 36 families were susceptible for PPSMV. The F2:3 families showing moderate resistant or susceptible phenotype to PPSMV were combined together into susceptible category, where the observed segregation ratio of 270:55 (susceptible: resistant). The families with susceptible reaction were more in number than the families with resistance phenotype. The segregation pattern in F2:3 families found comparable to the 13 (susceptible):3 (resistant) ratio. The phenotypic ratio of susceptible and resistant F2:3 families corroborated with F2 individual plants showed a good 13:3 ratio. The results clearly presented that inhibitory gene interaction; presence of two genes (inhibitory; SV1 and resistance; SV2) governing resistance to PSMD.
Short decamer random DNA markers and bulked segregant analysis
A set of 300 short decamer random DNA primers screened to detect polymorphism between resistance parent (BSMR 736) and susceptible parent (Gullyal white). Out of these 300 decamer random DNA primers, 32 primers (10.6%) repeatedly detected the polymorphic loci in parents. Thirteen primers in susceptible parent, 10 primers in resistant parent were found to be polymorphic; a set of 9 primers viz IABTPPAB12, IABTPPAB16, IABTPPH1, IABTPPH4, IABTPPH6, IABTPPN10, IABTPPN7, IABTPPN14 and IABTPPAB16) showed codominant nature polymorphism. Out of 9 co-dominant decamer random DNA primers, IABTPPN 7 recorded distinct, repeatable and high degree of polymorphism in the resistant parent, resistant bulk, susceptible parent and susceptible bulk. IABTPPN7 generated unique polymorphic DNA amplicom of approximately 1000 bp and 450 bp, after sequencing they were confirmed as 983 bp (IABTPPN7983) and 414 bp (IABTPPN7414), respectively. Out of these two markers identified, IABTPPN7414 was associated in coupling phase to the resistant allele, while IABTPPN7983 was linked in repulsion phase to the susceptible allele (Fig. 1). However, except IABTPPN7 other 8 primers could not distinguish parent and bulk.
Amplification pattern of coupling phase RAPD markers IABTPPN7983 and repulsion phase RAPD marker IABTPPN7414 in parents and resistant and susceptible bulks. M, 100 bp ladder DNA; RP, Resistant parent - BSMR 736; RB, resistant bulk; SP, susceptible parent - Gullyal white; SB, susceptible bulk.
Coupling phase associated IABTPPN7414 and repulsion phase associated IABTPPN7983 markers were further tested against the subset of resistance and susceptible DNA bulks. The IABTPPN7414 decamer random DNA marker amplicon amplified the polymorphic fragment only in the resistance parent and resistance F2 segregants and it was clearly absent in susceptible parent and susceptible F2 segregants. However, IABTPPN7983 decamer random DNA marker amplicon amplified the polymorphic fragment only in the susceptible parent and susceptible F2 segregants and it was clearly absent in resistance parent and resistance F2 segregants (Fig. 2).

Screening of the seven resistant and seven susceptible F2 plant DNA of the cross Gullyal white × BSMR 736 with a coupling phase RAPD markers IABTPPN7983 and repulsion phase RAPD marker IABTPPN7414, linked to PSMD. SP=PSMD susceptible parent Gullyal white, RP=PSMD resistant parent BSMR 736, Lane M=100 bp DNA ladder.
Linkage analysis
Primer IABTPPN7 was used to amplify DNA from all 325 F2 plants to confirm linkage with PSMD resistance and determine the rate of recombination (Fig. 3). Among the 325 F2 plants, IABTPPN7983 marker was absent in 68 and present in 257 F2 individual plants. Segregation of both PSMD susceptible and IABTPPN7983 marker in the F2 showed that IABTPPN7983 was present in 1 resistant and absent in 54 resistant plants, present in 256 susceptible plants, absent in 14 susceptible plants (Supplementary Table 1). Similarly, IABTPPN7414 marker was recorded in 255 F2 and absent in 70 F2 individual plants. The resistance bulk and parent specific amplicon was present in 53 out of 55 resistance F2 plant and absent in 68 out of 270 F2 susceptible plants (Supplementary Table 2). The segregation pattern for both the short decamer random DNA marker amplicons, IABTPPN7414 and IABTPPN7983 showed goodness of fit to 3:1 ratio, typical segregation ratio of a dominant marker (Table 1). Above these two IABTPPN7983 and IABTPPN7414 markers results which differed significantly from the expected 9:3:3:1 ratio (Table 2).

Segregation of coupling phase RAPD markers IABTPPN7983 and repulsion phase RAPD marker IABTPPN7414 across F2 plant DNA of the cross Gullyal white × BSMR 736 linked to PSMD. P1=PSMD susceptible parent Gullyal white, P2=PSMD resistant parent BSMR 736, Lane M=100 bp DNA ladder.

Nature and segregation behaviour of PSMD susceptible and resistant parent specific RAPD markers in F2 generation of the Gullyal white × BSMR 736 cross

Test of linkage between PSMD resistance and short nucleotide molecular markers in the F2 generation of the Gullyal white × BSMR 736 cross
Based on single marker ANOVA, it was found that both IABTPPN7983 (P<0.0001) and IABTPPN7414 (P<0.0001) were associated with the PSMD. The marker IABTPPN7983 and IABTPPN7414 individually accounted 31 and 36% of the variation for PSMD resistance respectively (Table 3). The genotypes of the F2 plants for PSMD reaction were deduced based on the marker phenotype according to Kotresh et al. (2006).
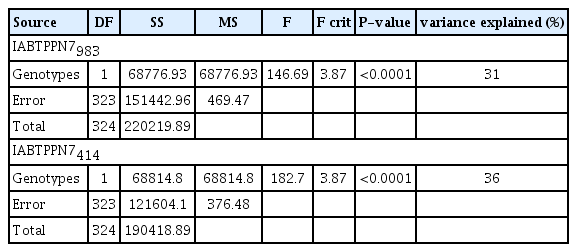
Analysis of variance for the PSMD in F2 generation based on the field performance of F2:3 families of the cross Gullyal white × BSMR 736
Furthermore, the IABTPPN7983 marker strongly associated with PSMD responsive SV1 (inhibitory) gene for PPSMV Bidar isolate (Fig. 4). However, another marker IABTPPN7414 did not record any linkage/association with SV2 (resistant) or SV1 gene. Linkage analysis showed that the marker IABTPPN7983 was located 23.9 cM away from the SV1 gene. In order to determine the usefulness of the RAPD marker, a set of 4 resistant, 1 moderately resistance and 7 susceptible genotypes were screened with primer IABTPPN7. Marker IABTPPN7983 was recoded in 5 out of 7 susceptible genotypes (71.4%) and absent in 1 of the 4 resistant genotypes (25%). Similarly, marker IABTPPN7414 was absent in 2 of the 7 susceptible genotypes (28.5%) and present in 3 out of 4 resistant genotypes (75%). Additionally, marker IABTPPN7983 and IABTPPN7414 was absent in moderately resistance genotype.

Development of F2 segregating population and analysis of marker linked to SV1 gene. “+”, Presence of amplicon; “−”, Absence of amplicon. 1Genotypes (+)-SV1SV1SV2SV2 (1), SV1SV1SV2sv2 (2), SV1SV1sv2sv2 (1), SV1sv1SV2SV2 (2), SV1sv1SV2sv2 (4), SV1sv1sv2sv2 (2); 2Genotypes (−)-sv1sv1sv2sv2 (1); 3Genotypes (+)-0; 4Genotypes (−)-sv1sv1SV2SV2 (1), sv1sv1SV2sv2 (2). Figures in the parentheses are the table χ2 values at 5% level of significance.
Discussion
Considerable efforts have been made to identify sources of resistance to PSMD in pigeonpea because of its importance as a pulse crop in Asia. The present study reports, the genetic nature of PPSMV resistance, which is under the control of two genes.
The use of molecular markers linked to economically important trait is very important to identify the genotypes caring such valuable trait without field screening. The RAPDs and SSRs markers are economically inexpensive and easy to use compared to RFLP and AFLPs. They have been employed to construct genetic linkage maps and for molecular tagging of various agronomic traits in melon (Oumouloud et al., 2008; Tezuka et al., 2009), pea (Janila and Sharma 2004; Vijayalakshmi et al., 2005), cabbage (Yu et al., 2009), pigeonpea (Dhanasekar et al., 2010; Kotresh et al., 2006), castor bean (Singh et al., 2003), pea (Tiwari et al., 1998), mungbean (Selvi et al., 2006), wheat (Gupta et al., 2006; Kumar et al., 2006), Phaseolus vulgaris (Caixeta et al., 2003; Martin and Menarim 2000), Glycine max (Zheng et al., 2003), Vicia faba (Avila et al., 2003), sorghum (Singh et al., 2006), common bean (Johnson et al., 1995; Young and Kelly 1997), groundnut (Mondal et al., 2007).
Single marker ANOVA and linkage analysis revealed linkage of repulsion phase marker in the F2 mapping population. There were very few reports indicate that coupling and repulsion phase decamer random DNA markers linked to some important plant traits (Johnson et al., 1995; Mondal et al., 2007; Tiwari, 1998). The flanking decamer random DNA markers which are associated in coupling and repulsion phase linkage with the locus, when it used together it would work genetically equivalent to a co-dominant marker (Kelly, 1995) and can overcome the limitation of dominant decamer random DNA markers. In addition, co-dominant flanking marker pair increases the selection efficiency as demonstrated by Young and Kelly (1997); Cherukuri et al. (2005), and further allows the identification of double recombinants not possible with flanking markers alone (Kelly and Miklas, 1998). BSA was reported by Michelmore et al. (1991) to identify RAPD markers tightly linked to genes for resistance to lettuce downy mildew. In recent years, some markers tightly linked to genes were found by using BSA method as such or with slite modificatiom (Altinkue et al., 2003; Govindaraj et al., 2005; Kotresh et al., 2006; Podlich et al., 2004; Mackay and Caligari, 2000; Xu et al., 1995; Zheng et al., 2002). BSA analysis involves screening for differences between pooled DNA samples derived from a segregating population that originated from a single cross, which improves the efficiency of primer screening (Michelmore et al., 1991). Using BSA combining short decamer random DNA marker, we identified decamer random DNA marker which were potentially linked to SV1 in pigeonpea (Fig. 1). BSA along with SMA analysis method helps in eliminating polymorphic but expectedly not going to be useful type of markers thus reducing cost and time required to identify tightly linked/associated markers to the target trait. This type of genotype data together with phenotype of the target trait is rightly suits for single marker analysis. There were some PSMD homozygous susceptible/resistance individuals, which did not display the expected decamer random DNA marker amplicon (Supplementary Table 1; Supplementary Table 2). Such individuals were considered as recombinants that might be the resultants of crossing over and segregation between the locus responsible for PSMD resistance and the locus of decamer random DNA primer. By testing with the 325 F2 individuals, genetic linkage analysis indicated that a short decamer random DNA marker, IABTPPN7983 was linked to the PSMD SV1and PSMD associated marker IABTPP7414, accounted for 31 and 36 per cent of the total phenotypic variance, respectively in F2 population (Fig. 3; Table 3). Similarly, BSA along with SMA reported by Zhang et al (2005) significant association with heat tolerance using SSR markers, RM3735 and RM3586, accounted 17 and 3 per cent of the total variation respectively. Also Milad et al. (2011), reported four RAPD markers (Pr11230bp, Pr19240bp, OPU06340bp and OPH13450bp) were associated with flag leaf senescence and explained 7.0, 50.0, 24.0 and 13.0 per cent of the phenotypic variation, respectively. Further, linkage analysis revealed a primer IABTPPN7, out of 32 identified polymorphic primers, produced a repulsing phase marker (IABTPPN7983) with a map distance of 23.9 cM from the PSMD SV1 gene of Bidar PPSMV isolate. The same primer generated a coupling phase marker (IABTPPN7414) that was not linked to PSMD SV1 or SV2 genes. Recently, Lee et al. (2010) reported a SCAR marker linked to the ms1 allele of male sterility in capsicum annum. Stability of short decamer random DNA marker itself a problem of using this marker so, such a tightly linked marker can be easily converted into more stable marker, like SCAR. In present study, the identified RAPD marker will be useful in MAS breeding for improving PSMD resistance of new pigeonpea cultivars.
Acknowledgments
We would like to thank the Department of Biotechnology (DBT) of the Government of India and Indian Council of Agricultural Research (ICAR) for the financial support (AKI-PGI) to undertake this study. The encouragement and suggestions of Dr. N.K Singh and Dr. Rajeev Varshney are acknowledged.