Characterization of Novel Trichoderma asperellum Isolates to Select Effective Biocontrol Agents Against Tomato Fusarium Wilt
Article information
Abstract
The use of novel isolates of Trichoderma with efficient antagonistic capacity against Fusarium oxysporum f. sp. lycopersici (FOL) is a promising alternative strategy to pesticides for tomato wilt management. We evaluated the antagonistic activity of 30 isolates of T. asperellum against 4 different isolates of FOL. The production of extracellular cell wall degrading enzymes of the antagonistic isolates was also measured. The random amplified polymorphic DNA (RAPD) method was applied to assess the genetic variability among the T. asperellum isolates. All of the T. asperellum isolates significantly reduced the mycelial growth of FOL isolates but the amount of growth reduction varied significantly as well. There was a correlation between the antagonistic capacity of T. asperellum isolates towards FOL and their lytic enzyme production. Isolates showing high levels of chitinase and β-1,3-glucanase activities strongly inhibited the growth of FOL isolates. RAPD analysis showed a high level of genetic variation among T. asperellum isolates. The UPGMA dendrogram revealed that T. asperellum isolates could not be grouped by their anta- gonistic behavior or lytic enzymes production. Six isolates of T. asperellum were highly antagonistic towards FOL and potentially could be used in commercial agriculture to control tomato wilt. Our results are consistent with the conclusion that understanding the genetic variation within Trichoderma isolates and their biochemical capabilities are required for the selection of effective indigenous fungal strains for the use as biocontrol agents.
Fusarium wilt, a vascular disease of tomato is caused by the soil borne fungus Fusarium oxysporum f. sp. lycopersici (Sacc.) Synder and Hans. This fungus occurs in most tomato-growing regions and can devastate a crop (Larkin and Fravel, 1998). Although tomato wilt-resistant cultivars are available, resistance often is overcome by new races of the pathogen, which appear in response to the newly resistant varieties (Jones et al., 1991; Larkin and Fravel, 1998). The growing reluctance to use of hazardous fungicides and synthetic fertilizers in agriculture has led several governments to encourage the research to develop alternative environmentally-friendly practices for controlling plant diseases. Biological control is one of these environmentally-friendly practices (Chet and Inbar, 1994; Cook, 1993; Monte, 2001).
Fungal species belonging to the genus Trichoderma (Ascomycota, Hypocreales) are widely spread in the soil and plant root ecosystems. Many Trichoderma species are effective biological control agents against a range of crop diseases (Abo-Elyousr et al., 2014; Dubey et al., 2007; Harman et al., 2004; Hermosa et al., 2000; Kim and Knudsen, 2013; Saber et al., 2009; Zhang et al., 2013). Trichoderma asperellum Samuels Lieckf. & Nirenberg a less well-studied species can control several plant pathogens including Fusarium wilt pathogen of tomato (Cotxarrera et al., 2002; Segarra et al., 2010). The capability of Trichoderma spp. to suppress plant diseases usually is attributed to their direct antagonistic effects on the fungal pathogen, and especially their ability to produce lytic enzymes e.g. chitinases and β-1,3-glucanases (Benítez et al., 2004; Viterbo et al., 2002). These enzymes hydrolyse the pathogen’s cell wall thereby limiting the growth of fungal pathogens.
In the last few years, commercially available Trichoderma products (biopesticides, biofertilizers and soil amendments) have been used as part of environmental friendly protocols to defend crops against plant pathogenic organisms and to increase yields (Harman et al., 2004; Mukherjee et al., 2012). Despite the commercial successes of these microbial-based fungicides, the major limitations remain their restricted efficacy and inconsistency under field conditions. Consequently, more efficient Trichoderma strains with high antagonistic potential capabilities are needed for successful biological control systems.
However, understanding the genetic variability within Trichoderma strains and their biological and biochemical activities are necessary to improve the selection of the different isolates as biocontrol agents (Consolo et al., 2012; Sharma et al., 2009). In the present investigations, molecular (RAPD markers) and biochemical (production of cell wall degrading enzymes) characterization of 30 isolates of T. asperellum in relation to their antagonistic behavior against four isolates of F. oxysporum f. sp. lycopersici were studied. Such information could be valuable for development of new bio-fungicides to control tomato Fusarium wilt disease without using synthetic fungicides.
Materials and Methods
Cultures of Trichoderma asperellum
Thirty isolates of T. asperellum (TS1; TS2; TS3; TS4; TS7; TS9; TS10; TS12; TS13; TS14; TS15; TS16; TS17; TS21; TS24; TS28; TS29; TS30; TS31; TS32; TS33; TS34; TS35; TS36; TS38; TS39; TS41; TS42; TS43 and TS44) were used in the present study. These strains were originally isolated from soil samples, collected from different agricultural fields in Riyadh region, Saudi Arabia, using dilution plate method onto Trichoderma selective medium (TSM) according to Elad and Chet (1983). The fungal isolates were purified through subcultures from single spores and identified to species level based on sequences of the internal transcribed spacer regions 1 and 2 (ITS1 and ITS2) of the nuclear ribosomal DNA. All of the fungal isolates were maintained on potato dextrose agar (PDA) medium for further use.
Cultures of Fusarium oxysporum f. sp. lycopersici
Four isolates of F. oxysporum f. sp. lycopersici (FOL-1, FOL-2, FOL-3 and FOL-4) used in the present study were recovered from infected roots of tomato plants showing wilt symptoms. The root samples were collected during tomato-farm visits of different places between 2011 and 2012. Based on the pathogenicity tests, these isolates were virulent on tomato cultivar Farah (data not published). The pathogen isolates were re-isolated from the diseased tissues to confirm Koch’s postulates. Morphological identifications of isolates were carried out using the criteria of Leslie and Summerell (2006). These isolates were maintained in 15% glycerol at −80°C.
Screening of T. asperellum isolates for antagonistic activity
Isolates of T. asperellum were tested against the FOL isolates by using the dual culture technique described by Morton and Stroube (1955). Each Petri-dish (9 cm) containing PDA was inoculated with two 5 mm diameter mycelial discs; one of the FOL strain and one of Trichoderma strain placed 7 cm apart from each other. The FOL discs were placed in the Petri-dishes 2 days before the Trichoderma discs. For control treatments, a FOL disc was placed on the PDA medium. The inoculum discs were obtained from the margin of actively growing 7 day old fungal cultures. Four replicaties were maintained for each treatment. Plates were incubated in the darkness at 25±2°C for 6 days. Radial growth of FOL strains was measured, and percent inhibition of average radial growth was calculated in relation to growth of the controls as follows: I=(C−T/C)×100. Where I=percent inhibition: C=radial growth of pathogen (mm) alone (control); T=radial growth of pathogen (mm) in the presence of Trichoderma isolates (Edington et al., 1971). The experimental design used was a completely randomized with four Petri dishes for each isolates. Microscopic examinations were made at 100× magnification looking for signs of mycoparasitism at the interaction zone between the two fungal cultures. This experiment was conducted twice for reproducibility.
Screening of T. asperellum isolates for enzyme production
Trichoderma asperellum isolates were grown in 100 ml liquid mineral synthetic medium (MSM) contained following components (in g/l): MgSO4·7H2O, 0.2; K2HPO4, 0.9; KCl, 0.2; NH4NO3, 1.0; FeSO4·7H2O, 0.002; MnSO4, 0.002 and ZnSO4, 0.002, supplemented with 0.1% cell walls of FOL to induce cell wall enzymes production, or 0.1% glucose as control (Mondéjar et al., 2011). The cultures were grown at 150 rpm on a rotary shaker for 6 days at 25°C. The mycelia were harvested by filtration through Whatman No. l filter paper and the filtrate centrifuged at 4°C for 10 min at 5000×g. The supernatant was decanted and stored at −20°C until used to assay enzyme activity (El-Katatny et al., 2000).
Chitinase activity was assayed with a colorimetric method using Jenway 6715 spectrophotometer (Bibby Scientific Limited, Staffordshire, UK) as described by Molano et al. (1977) with minor modifications. The assay was performed in a 1.5 ml micro-centrifuge tube containing 500 μl of 0.5% chitin (suspended in 50 mM acetate buffer pH 5.2) and 500 μl of the supernatant. The mixture was incubated at 37°C for 4 h with shaking. To stop the reaction, the tubes were placed in a boiling water bath for 5 min and then 500 μl of dinitrosalicylate were added to each tube. The amount of released reducing sugars due to enzyme activity was determined based on the standard curves of N-acetyl-D-glucosamine (GlcNAc) measured as absorbance at of 540 nm. Enzyme activity was expressed as pmol/s/ml.
β-1,3 glucanase activity was measured by incubating 200 μl of the supernatant with 500 μl of 5.0% (w/v) laminarin (suspended in 50 mM acetate buffer pH 4.8) in a 1.5 ml micro-centrifuge tube at 45°C for 60 min and measuring the amount of reducing sugars with dinitrosalicylate (DNS) (Miller, 1959). The amount of released reducing sugars due to enzyme activity was determined based on the standard curves of glucose measured as absorbance at 540 nm. Enzyme activity was expressed as nmol/s/ml.
Molecular characterization of T. asperellum isolates
DNA extraction
Tricoderma asperellum isolates were grown in 100 ml of potato dextrose broth (PDB) (Difco, USA) at 25±1°C for 7 days. Mycelia were harvested by filtration through filter paper and washed with distilled water. Fungal DNA was extracted following the protocol of Raeder and Broda (1985). The total DNA extracted was checked in 1.5% agarose gel, and the DNA concentration was adjusted to 50 ng/μl and stored at −20°C for further use (Sambrook et al., 1989).
RAPD-PCR conditions
The DNA extracted from isolates was amplified with the random amplified polymorphic DNA (RAPD) technique according to Williams et al. (1990). All PCR reactions were carried out in a final volume of 25 μl containing: 1 μl 10 μM primer, 0.3 μl Taq DNA polymerase (5 U/μl), 2.5 μl 10× PCR buffer (containing 15 mM Mg Cl2), 1 μl 10 mM MgCl2, 1 μl 2 mM dNTPs (of each), 1 μl of template DNA (approximately 50 ng) and 18.2 μl sterilized deionized water. The nucleotide sequences of the RAPD primers used in this study are shown in Table 1. RAPD reactions were conducted in a Techne TC-412 thermocycler (Barloworld Scientific Ltd, United Kingdom). RAPD reactions were initially heated to 94°C for 5 min and then subjected to 45 cycles of denaturation step for 1 min at 94°C, annealing step for 1 min at 37°C and an extension step for 2 min at 72°C, followed by a final extension cycle for 10 min at 72°C. The PCR products were analyzed by electrophoretic separation in 2% agarose gels stained with 0.5 μg/ml ethidium bromide, running with 0.5× TBE buffer. The electrophoresis was carried out at constant 80 V for ~2 h using Bio-Rad submerge gel electrophoresis system. Mid-range DNA Ladder ranging from 100 to 3,000 bp (Jena Bioscience, place, Germany) was used as a standard molecular marker. To visualize and document RAPD patterns, agarose gels were viewed and photographed using InGenius LHR gel imaging and analysis system (Syngene, United Kingdom).
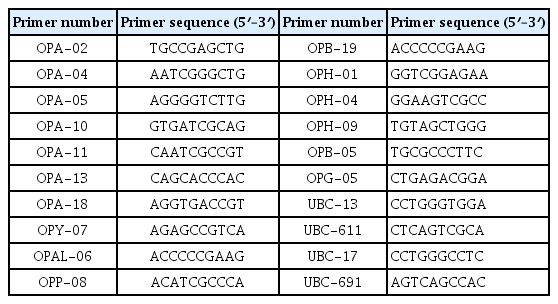
Primer sequences used in this study
Data scoring and analysis
The amplifications were repeated more than three times for each primer before final scoring. RAPD primers that gave reproducible and scorable amplifications were used in the analysis. The banding patterns of all isolates were obtained using the selected primers scored on the basis of the presence (1) or absence (0). Pair-wise genetic comparisons based on RAPD fingerprints among Trichoderma isolates were calculated using Jaccard’s similarity coefficient embedded in NTSYS-pc Software version 2,1 (Numerical Taxonomy System Applied Biostatistics, Setauket, New York). Phylogenetic trees were constructed using unweighted pair-group method with arithmetical averages (UPGMA) embedded in NTSYS (Rohlf, 2005). To estimate the allelic variation of each RAPD primer, the polymorphism information content (PIC) was calculated according to the formula PIC = 1−∑j=1nPij2 described by Anderson et al. (1993), where Pij represents the frequency of the ith allele for marker j and the summation extends over n alleles of each RAPD marker.
Statistical analysis
All experiments were conducted twice to confirm the results. Because there were no significant differences between the two repeats for any of the treatments, the data of the two experiments were combined for final analyses (Gomez and Gomez, 1984). The statistical analyses were performed using SAS software system (SAS Institute Inc., 2003). The data were statistically analysed in factorial model of a completely randomized experimental design. Before undergoing statistical analysis, the percentage inhibition data were arcsin-transformed (Gomez and Gomez, 1984). Analyses of variances (ANOVA) were performed for all data sets. All data are presented as means, and the statistical significance was indicated at P<0.05. The relationships between the genetic distance matrices obtained from the RAPD markers and the Euclidean distance matrix generated from both the antagonistic capabilities and hydrolytic enzymes activities of T. asperellum isolates were analyzed according to Mantel (1967).
Results
Screening the antagonistic activity of T. asperellum isolates
The antagonistic capabilities of T. asperellum 30 isolates were assessed by the inhibition of FOL growth through the dual culture test. In general, the antagonistic isolates considerably grew faster than FOL isolates. Trichoderma asperellum isolates caused significant reduction in the mycelial growth of FOL isolates. The highest inhibition values, main effects ranged between 68 and 71%, were obtained with the isolates TS39, TS12, TS42, TS9, TS32 and TS36 (Table 2). Most of the T. asperellum isolates showed moderate inhibition values (61–65%). However, seven isolates (TS17, TS2, TS1, TS29, TS30, TS28 and TS 24) showed the lowest inhibition values (32–36%) (Table 2).

Antagonistic effect of T. asperellum isolates against 4 different isolates of FOL in dual culture plate after six days of inoculation at 25±1°C
The interaction of T. asperellum and FOL isolates showed significantly differences in growth inhibition of the pathogen isolates. Isolates TS9 and TS12 caused the highest inhibition effect on FOL1 growth (71 and 68% respectively). Maximum growth inhibitions of FOL2 and FOL4 were occurred in the interaction with isolates TS12 (66 and 78% respectively) and TS39 (63 and 77% respectively). In the case of isolate FOL3 the highest inhibition values were obtained with antagonistic isolates TS32 and TS39 (82%) (Table 2). Overall, isolates FOL3 and FOL4 were highly susceptible to T. asperellum isolates. However, isolates FOL2 and FOL1 were least inhibited by T. asperellum isolates (Table 2).
Morphologically, the mycoparasitic action of T. asperellum isolates showed overgrowth and heavy sporulation on the pathogen colonies (Fig. 1). At the microscopic observations, the pathogen showed abnormal hyphal morphology and lysis of mycelia on the interaction areas.
Mycoparasitic action of T. asperellum isolate TS12 on the mycelium of F. oxysporum isolate FOL-4 showing overgrowth (A) and heavy sporulation (B).
Screening the enzyme production of T. asperellum isolates
The fungal antagonistic isolates were screened for their ability to produce cell wall degrading enzymes. In general, T. asperellum strains grown in liquid cultures containing cell walls of FOL secreted higher levels of enzymes than those grown with glucose as a carbon source (data not shown). Data in Table 3 shows that T. asperellum isolates possessing a wide range of hydrolytic enzymes activities. Isolates TS39, TS12, TS42, TS9, TS32 and TS36 exhibited the highest activities of chitinase (8.7–10.3 pmol/s/ml) and β-1,3-glucanases (1.4–1.98 nmol/s/ml). The lowest activities of chitinase (2.3–3.5 pmol/s/ml) and β-1,3-glucanases (0.8–0.9 nmol/s/ml) were obtained with isolates TS17, TS2, TS1, TS29, TS30, TS28 and TS 24. However, most of the remaining isolates showed moderate activities of both lytic enzymes (Table 3).
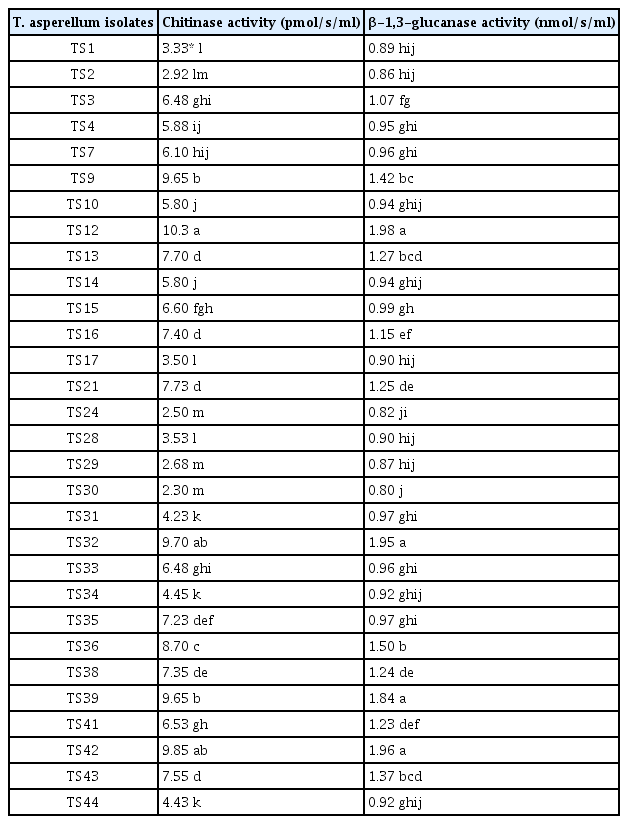
Hydrolytic enzymes activities of T. asperellum isolates grown in liquid cultures media supplemented with 0.1% cell walls of FOL after six days of incubation at 25±1°C
Molecular characterization of T. asperellum isolates
To genotype the 30 T. asperellum isolates, twenty RAPD primers were initially screened with DNA of five isolates. Eight primers (OPA-11; OPAl-06; UBC-611; UBC-17; OPH-01; OPY-07; OPB-05 and OPB-19) were selected to amplify reproducible, scorable RAPD bands with high levels of polymorphisms. Representative results obtained with those primers are given in Table 4. Fig. 2 shows also a representative banding pattern using primer OPY-07. A total of 139 bands ranged from 100 to 3300 bp were scored. Out of these bands, 114 (82%) were of polymorphic. The average number of bands per primer was 17.4, with a maximum 21 (OPA-11) and a minimum 13 (OPAL-06) bands. Polymorphism ratios for the primers ranged between 65 to 100%. RAPD primers OPH-01and OPB-5 showed the highest polymorphism ratio, whereas the primer UBC-611 had the lowest polymorphism ratio. The polymorphism information content (PIC) values ranged from 0.882 in case of OPB-05 to 0.939 for the OPY-07 primer.
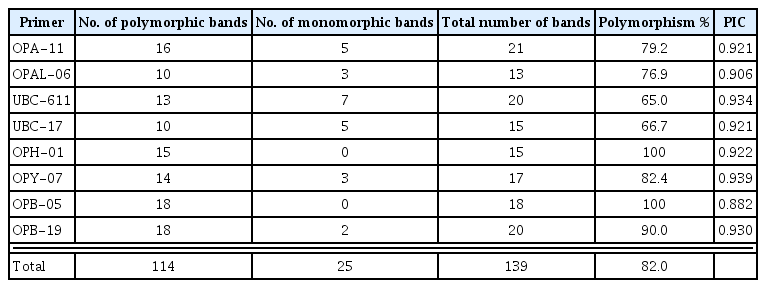
Number of polymorphic and common bands detected by the selected eight RAPD primers among 30 isolates of T. asperellum
RAPD patterns of thirty T. asperellum isolates, generated by 10-mer random primer OPY-07.
The analysis of RAPD data exhibited a wide range of genetic similarity coefficients (0.443 to 0.944) with an average of 0.76. At the 67% similarity level, the fungal isolates grouped into five clusters on the UPGMA dendrogram (Fig. 3). Most of the isolates included in cluster I (26/30) that received 67% bootstrap value (Fig. 3). The other four clusters were represented by only one isolate (Fig. 3). The most genetically distant isolate was TS24 (cluster V). The RAPD markers were able to distinguish all isolates at 94% similarity level. Trichoderma isolates (TS39, TS12, TS42, TS9, TS32 and TS36) showing the highest FOL growth inhibitory were grouped in a sub-cluster under cluster I at ~78% genetic similarity (Fig. 3). This sub-cluster received 67% bootstrap value and contained 12 other isolates showing moderate and low FOL growth inhibitory.
Dendogram illustrating the genetic relationship among thirty T. asperellum isolates varied in their antagonistic capabilities against Fusarium wilt pathogen. The scale portrays a similarity index based on Jaccard’s coefficient, and the dendrogram was developed using UPGMA clustering Procedure. The letters in parentheses indicate the antagonistic capabilities of T. asperallum isolates against Fusarium wilt pathogen: (H) high, (M) moderate and (L) low. Bootstrap values obtained from 1,000 replications are indicated above the tree branches. RAPD clusters are designated in roman numerals.
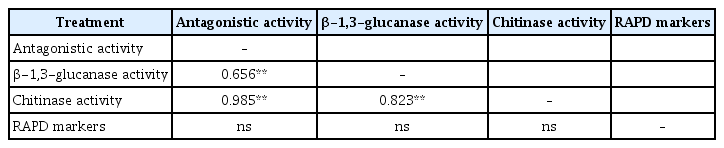
Correlations between antagonistic activities, hydrolytic enzymes and RAPD markers of T. asperellum isolates
Based on the Mantel test, there were significant relationships between the antagonistic capabilities of T. asperellum isolates and the production of both chitinase (r=0.985; P<0.001) and β-1,3-glucanases (r=0.659; P<0.001) (Table 5). However, there was no significant correlation between RAPD markers and the antagonistic or enzymatic activities of T. asperellum isolates (Table 5).
Discussion
Alternative bioagnets to chemical fungicides are needed to control the vascular wilt pathogen, Fusarium oxysporum f. sp. lycopersici (FOL), which is a major limiting factor of tomato production worldwide (Larkin and Fravel, 1998). In the present study, 30 isolates of T. asperellum collected from different agricultural soils in the Riyadh region of Saudi Arabia were biologically, biochemically and genetically characterized to identify and select the most efficient antagonistic ones against FOL. In dual culture tests, the antagonistic effect of T. asperellum isolates was evaluated against 4 different isolates of FOL. The T. asperellum isolates grew considerably faster than the FOL isolates and quickly overwhelm the pathogen. The ability to grow rapidly gives antagonists an important advantage in competition for space and nutrients with pathogen (Benítez et al., 2004; Simon and Sivasithaparam, 1988). All of the tested isolates of T. asperellum significantly reduced mycelial growth of FOL strains. The highest inhibition values were obtained with isolates TS39, TS12, TS42, TS9, TS32 and TS36. These isolates overgrew and sporulated on the pathogen colonies. In the interaction region, the FOL mycelia had abnormal morphology and were lysing, which implies the occurrence of strong mycoparasitism. These results are in agreement with numerous previous studies where T. asperellum isolates showed high capabilities for being versatile biocontrol agents (Cotxarrera et al., 2001; de los Santos-Villalobos et al., 2013; Gromovykh et al., 2002; Marcello et al., 2010; Tondje et al., 2007; Trillas et al., 2006). In this study, the interaction of indigenous T. asperellum isolates with FOL isolates resulted in significantly different amounts of pathogen inhibition. For example, TS12 had the highest inhibitory effect on the growth of FOL-2 and FOL-4 isolates, whereas, TS9 was on FOL-1. In addition, the four isolates of FOL reacted differently to the antagonistic activities of T. asperellum isolates. However, isolates FOL-3 and FOL-4 were the most susceptible and isolates FOL-2 and FOL-1 were the least inhibited. These results are consistent with those of Markovich and Kononova (2003) who found that the mycoparasitic capacity of various species and isolates of Trichoderma varies. It has been found that some Fusarium pathogenic strains have deleterious effects on Trichoderma spp. where they produce mycotoxins such as fusaric acid. These mycotoxins have direct antagonistic activity that can down regulate Trichoderma mycoparasitism related genes (El-Hasan et al., 2008; Lutz et al., 2003; Sharma, 2011). Moreover, Sivan and Chet (1989) suggested that some F. oxysporum strains have cell walls containing proteinaceous compounds that make these strains more resistant to Trichoderma mycoparasitism. Thus, a combination of microbial antagonists in a single preparation is more likely effective to control one or more FOL isolates and to increase disease suppression under diverse soil environmental conditions (Meyer and Roberts, 2002).
Mycoparasitism is a complex process during which antagonistic Trichoderma strains secrete hydrolytic enzymes (e.g. chitinases and β-1,3-glucanases) that hydrolyze the main structural compounds of fungal cell walls, chitin and β-glucan (Kubicek et al., 2001; Kullnig et al., 2000; Qualhato et al., 2013; Verma et al., 2007; Woo et al., 2006). In the present study, T. asperellum isolates were characterized based on the secretion of hydrolytic enzymes. Trichoderma asperellum isolates grown in liquid cultures containing cell walls of FOL had higher levels of enzymatic activities than did those grown with glucose as carbon source. This difference suggests that the production of these enzymes increased in response to the presence of fusarial cell walls (El-Katatny et al., 2000; Mondéjar et al., 2011; Qualhato et al., 2013). High differences in the levels of the enzymatic activities within the recovered T. asperellum isolates were observed. This finding may be attributed to the induction and variation in the expression of hydrolytic enzyme genes of T. asperellum in response to the presence of FOL cell wall components in culture media (Dana et al., 2001; Marcello et al., 2010). There was a significant relationship between the antagonistic capacity of the T. asperellum isolates and the production of chitinase and β-1,3-glucanases. Antagonistic isolates (TS12, TS32, TS42, TS39, TS9 and TS36) with the highest levels of enzyme activities showed also the most inhibitory effect on the growth of FOL. Thus, efficient antagonistic isolates inhibit FOL growth through the production of lytic enzymes. Lopes et al. (2012) found a positive correlation between the lytic enzymes activities and the antagonism capacity of T. asperellum against Sclerotinia sclerotiorum. Moreover, Qualhato et al. (2013) reported that there was a positive correlation between the amounts of secreted cell-wall degrading enzymes by Trichoderma strains and their ability to control plant pathogenic fungi.
PCR-based genetic markers including random amplified polymorphic DNA (RAPD) have been used to evaluate genetic variation and taxonomic relationships in fungi including Trichoderma spp. (Arisan-Atac et al., 1995; Goes et al., 2002; Muthumeenakshi and Mills, 1995). RAPD markers were used to estimate the genetic variation within 30 T. asperellum isolates. The analysis of RAPD data exhibited a wide range of genetic similarity coefficients with an average of 0.76. This high level of genetic variation could be due to the recombination that might occur during the sexual reproduction (Chaverri et al., 2003; Sharma et al., 2009). The RAPD markers differentiated all T. asprellium isolates at 94% genetic similarity making it a powerful method for identifying and fingerprinting fungal isolates. In this study, each T. asprellium isolate had a unique RAPD fingerprints. Therefore, we anticipate that RAPDs can be used to eliminate duplicate isolates. RAPDs can be also used to monitor the genetic stability of the antagonistic Trichoderma isolates over time in fields (Avis et al., 2001). The most antagonistic Trichoderma isolates against FOL (TS39, TS12, TS42, TS9, TS32 and TS36) were part of a sub-cluster that contained 18 isolates. The other 12 isolates had either moderate or low antagonistic activities against FOL. Thus, RAPD fingerprints showed no clear association with either antagonistic behavior or hydrolytic enzyme activity of T. asperellum. Additionally, Mantel test found no significant correlation between RAPD markers and the antagonistic or enzymatic activities of T. asperellum. This could be due to the fact that the tested biological and biochemical traits capture only a small portion of allelic variation of functional genes, whereas RAPD is a genome-wide fingerprinting technique and in most cases target repetitive DNA regions. Sharma et al. (2009) also found no correlation between genetic variability assessed by RAPD markers and the ability of Trichoderma isolates to antagonize Sclerotium rolfsii. However, Gajera and Vakharia (2010) found a relationship between RAPD polymorphisms of Trichoderma isolates and their antagonism against Aspergillus niger.
In conclusion, our results suggest that combined studies, including biological, biochemical and molecular technologies, are necessary to select indigenous Trichoderma strains that can be used under different environmental conditions. From the 30 T. asperellum isolates, six (TS39, TS12, TS42, TS9, TS32 and TS36) were highly producer for cell-wall degrading enzymes and showed high antagonistic activity against FOL isolates. Genetic variability among these isolates in addition to their differences in aggressiveness toward FOL isolates suggest that combinations of isolates could further be applied in both greenhouse and field studies to manage tomato-Fusarium wilt.
Acknowledgments
This research was financially supported by the King Abdulaziz City for Science and Technology (KACST), Riyadh, Saudi Arabia.