Comparison of Bacterial Community of Healthy and Erwinia amylovora Infected Apples
Article information

Abstract
Fire blight disease, caused by Erwinia amylovora, could damage rosaceous plants such as apples, pears, and raspberries. In this study, we designed to understand how E. amylovora affected other bacterial communities on apple rhizosphere; twig and fruit endosphere; and leaf, and fruit episphere. Limited studies on the understanding of the microbial community of apples and changes the community structure by occurrence of the fire blight disease were conducted. As result of these experiments, the infected trees had low species richness and operational taxonomic unit diversity when compared to healthy trees. Rhizospheric bacterial communities were stable regardless of infection. But the communities in endosphere and episphere were significanlty affected by E. amylovora infection. We also found that several metabolic pathways differ significantly between infected and healthy trees. In particular, we observed differences in sugar metabolites. The finding provides that sucrose metabolites are important for colonization of E. amylovora in host tissue. Our results provide fundamental information on the microbial community structures between E. amylovora infected and uninfected trees, which will contribute to developing novel control strategies for the fire blight disease.
Apple (Malus domestica) is widely cultivated and one of the most economically important agricultural products (Wassermann et al., 2019; Zheng et al., 2020). Apples have various nutrition-rich molecules, such as polyphenols and vitamins that benefit human health (Wassermann et al., 2019). In 2020, apple production in China (40.5 million ton, Mt), followed by the United States (4.6 Mt), Turkey (4.3 Mt), India (2.3 Mt), Russia (1.5 Mt), and South Korea (0.5 Mt) and around the world were around 83 Mt of apples are produced annually (Ritchie and Roser, 2020).
Various diseases occur during apple cultivation, most commonly, scabbing (Venturia inaequalis), powdery mildew (Podosphaera leucotricha), and fire blight (Erwinia amylovora) (Vincent et al., 2010). The fire blight pathogen causes significant damage in rosaceous plants such as apples, pears, and raspberries. Apples especially face considerable economic losses when affected (Born et al., 2017; Bubán and Orosz-Kovács, 2003). Since the fire blight disease was reported in the United States in the 1780s, it has spread to more than 50 countries including Europe, Kyrgyzstan, and South Korea (Zhao et al., 2019). The fire blight disease exhibits symptoms of burning from reddish to black in leaves, twigs, flowers, and fruits. E. amylovora infected branches, twigs, and fruits develop a watery ooze during high humidity (Ait Bahadou et al., 2018). During the flowering stage, E. amylovora can be spread to flowers by insects, wind, or rain (Cui et al., 2021; van der Zwet et al., 2012). However, the disease continuously reoccurs, and causes significant damage in apple production (Aćimović et al., 2015).
To manage the fire blight disease, copper-based bactericides are widely used, but these copper compounds have a high risk of phytotoxicity (Aćimović et al., 2015; Sholberg et al., 2001). Control of the disease by antibiotics, such as streptomycin and oxytetracycline, has limited effect. Additionally, the antibiotics facilitate the emergence of resistant pathogens (Aćimović et al., 2015; McManus et al., 2002). Alternatively, biological control for the fire blight disease using beneficial microorganisms has been considered as the most eco-friendly and sustainable control method. Bacillus subtilis BD170, Lactobacillus plantarum PM411, TC54 and TC92, Pseudomonas fluorescens EPS62e, and Pantoea agglomerans E325 are reported as biological control agents to manage fire blight disease (Broggini et al., 2005; Cabrefiga et al., 2007; Pusey et al., 2011; Roselló et al., 2013).
Plant microbiota have an important role in plant growth and significant impact on abiotic and biotic stress reduction of the plant (Kim et al., 2019a; Wassermann et al., 2019). Understanding microbial ecological information such as pathogen mobilization, dissemination, and interaction with other microbes in the environment are critical factors in promoting plant wellness (Bengtsson-Palme et al., 2018). However, plant associated microbial ecosystems have not been studied in the past due to a lack of technology, which currently is progressing with the appearance of metagenomic technology. Accordingly, the metagenomics approach is considered a revolutionary field of microbial ecology through techniques without culturing method (Williamson and Yooseph, 2012). Despite the knowledge of pathogen-infected plant microbiome community structures, only limited information is available on apples and their microbiota. In this study, we compared the structure of bacterial community, species abundance, diversity, and metabolite patterns between the fire blight diseased and healthy apples.
Bacterial community structures were compared in healthy and unhealthy (fire blight diseased) apple trees (cv. Fuji). The unhealthy samples were obtained from two different orchards A and B (Chungju province, South Korea; GPS information is not disclosed in accordance with regulations), and orchard C, the fire blight disease free orchard located in Eumsung province, South Korea. Five trees were randomly selected in each orchard for sampling. In E. amylovora infected trees, typical fire blight symptoms appeared on twigs and fruits (Supplementary Fig. 1). Symptoms and signs of fire blight were observed overall from 70% to 80% trees. The infected twigs and leaves turned from brown to black from the tip. Immature fruits of apple showed signs of bacterial ooze colored yellow and orange (Supplementary Fig. 1).
From each tree, rhizosphere soil, episphere fruit and leaf, endosphere fruit and twig samples were collected in June 2020. The rhizosphere soil was collected from root surface 1–3 mm and filled in a 50-ml tube (n = 5). Episphere samples were prepared that fruits (each tree, n = 3–5) and leaves (each tree, n = 10–15). Endosphere sample twigs (each tree, n = 2–3) were collected that cut inside 10-length from the tip and leaves (each tree, n = 10–15). For isolation of episphere microbiomes, the fruit was peeled leaving only the pulp using a disinfected knife, 10 g of sample were transferred into a 50-ml tube. Twig (1.5 g) and leave (5 g) were weighed and transferred to a 50-ml tube. Before DNA extraction, samples in a 50-ml tube were sonicated at 35 kHz with 50 ml of 1× phosphate buffered saline (PBS) buffer (10× PBS: 80 g of NaCl, 2 g of KCl, 1.44 g of Na2HPO4, 2.4 g of KH2PO4, per liter adjusted to a pH of 7.4) for 45 s and vortexed for 30 s three times (Kim et al., 2019a, 2019b; Yao et al., 2019). The suspension was transferred to a new tube, then centrifuged at 1,968 ×g, 4°C for 20 min and the supernatant was discarded. The tube was filled with 5 ml of 1× PBS buffer and 50% glycerol in the same proportion and stored at −80°C. To isolate microbiomes in the endosphere. The sonicated samples were sterilized in 70% ethanol for 30 s, 1% NaOCl for 30 s, then washed in ddH2O for 2 times and dried for 1 h at a clean bench at room temperature. Completely dry samples were grinded with liquid nitrogen and stored at −80°C. Total DNA was extracted with a FastDNA SPIN Kit for Soil (MP Biomedicals, Irvine, CA, USA) using 0.5 g of rhizosphere, 0.3 g of endosphere, and 0.5 ml of episphere. DNA was extracted following the manufacturer’s instruction. The quality and quantity of DNA were verified using NanoDrop 2000 (Thermo Fisher Scientific, Waltham, MA, USA)
DNA was diluted to 5–8 ng/μl and amplified by 341F-805R primer including overhang adapter sequences and PNA probes (pPNA, mPNA) (Lundberg et al., 2013) to block plant-derived mitochondrial chloroplasts (Supplementary Table 1). PCR reaction of rhizosphere samples was conducted with a total 40 μl of mixture (2.5 μl of DNA, 1 μl of each primer [10 pmol], 20 μl of 2× PCR buffer for KOD FX Neo, 4 μl of dNTPs [2 mM], 0.3 μl of KOD FX Neo [1.0 U/μl; Toyobo, Tokyo, Japan] with ddH2O added to 40 μl). PCR reaction of rhizosphere samples followed the conditions: 95°C for 3 min, 25 cycles condition were 95°C for 30 s, 55°C for 30 s, 72°C for 30 s by T100 thermal cycler (Thermo Fisher Scientific). PCR reactions for endosphere and episphere samples were conducted with 2.5 μl of genomic DNA, 1 μl of each primer (10 pmol), 2.5 μl of each PNA probe (7.5 μM), 12.5 μl of KAPA HiFi Hot-Start ReadyMix (Roche, Basel, Swiss) in a final volume 22 μl, following condition: at initial denaturation step was 95°C for 3 min and 25 reaction cycle condition was 95°C for 30 s, 78°C for 10 s, 55°C for 30 s, 72°C for 30 s. Then, the PCR products were purified using AMPure XP (Beckman Coulter, Brea, CA, USA). Next generation Illumian Miseq sequencing was performed by Macrogen Co. (Seoul, Korea). Raw sequence was manufactured to designate operational taxonomic units (OTUs) by DADA2 (Callahan et al., 2016) version 1.8 guidelines (https://benjjneb.github.io/dada2/tutorial_1_8.html) in R version 4.0. libraries were truncated to 265, 215 more than 30 quality score and merged with forward, reverse reads and removed chimera. Each sequence was identified by IDTAXA (Murali et al., 2018) machine learning algorithm which had been learned about Silva release 138 (https://www.arb-silva.de) (Quast et al., 2013). Analysis of rarefaction curves, alpha diversity, and beta diversity was conducted by package ggiNEXT (version 2.0.20), pyloseq (version 3.12), vegan (version 2.5-7) and others. Principal coordinates analysis (PCoA) appeared to visualize similarities and dissimilarities based on Bray-Curtis distance. Deseq version 3.12 was used to analyze metabolite pathways in each sample. Graph visualization was performed by ggplot2 version 3.3.3. and Kruskal-Wallis test was used to statistical analysis (Kruskal and Wallis, 1952).
To compare bacterial composition according to infection of E. amylovora, a total of 4,393,392 reads were identified and these sequences were clustered into 1,034,743 for orchard A (unhealthy), 985,836 for orchard B (unhealthy), 404,438 for C orchard (healthy) in 2,425,017 taxonomic units (Supplementary Table 2). In endosphere (fruit, twig) of unhealthy trees inferred OTU numbers showed below 32 and 16 respectively (Fig. 1A). OTU numbers of episphere (fruit, leaf) of unhealthy trees appeared below 40, 23. OTU numbers of endosphere (fruit, twig) and episphere (fruit, leaf) were higher in healthy trees than E. amylovora infected trees according to predicted values. Bacterial alpha diversities had a similar rhizosphere value regardless of fire blight disease occurrence (Fig. 1B). However, all other tissues showed high alpha diversities values in healthy trees than the infected trees. These results were able to confirm a significant difference between E. amylovora infection by Kruskal-Wallis analyses and all data were available at Gen-Bank (Supplementary Table 3).
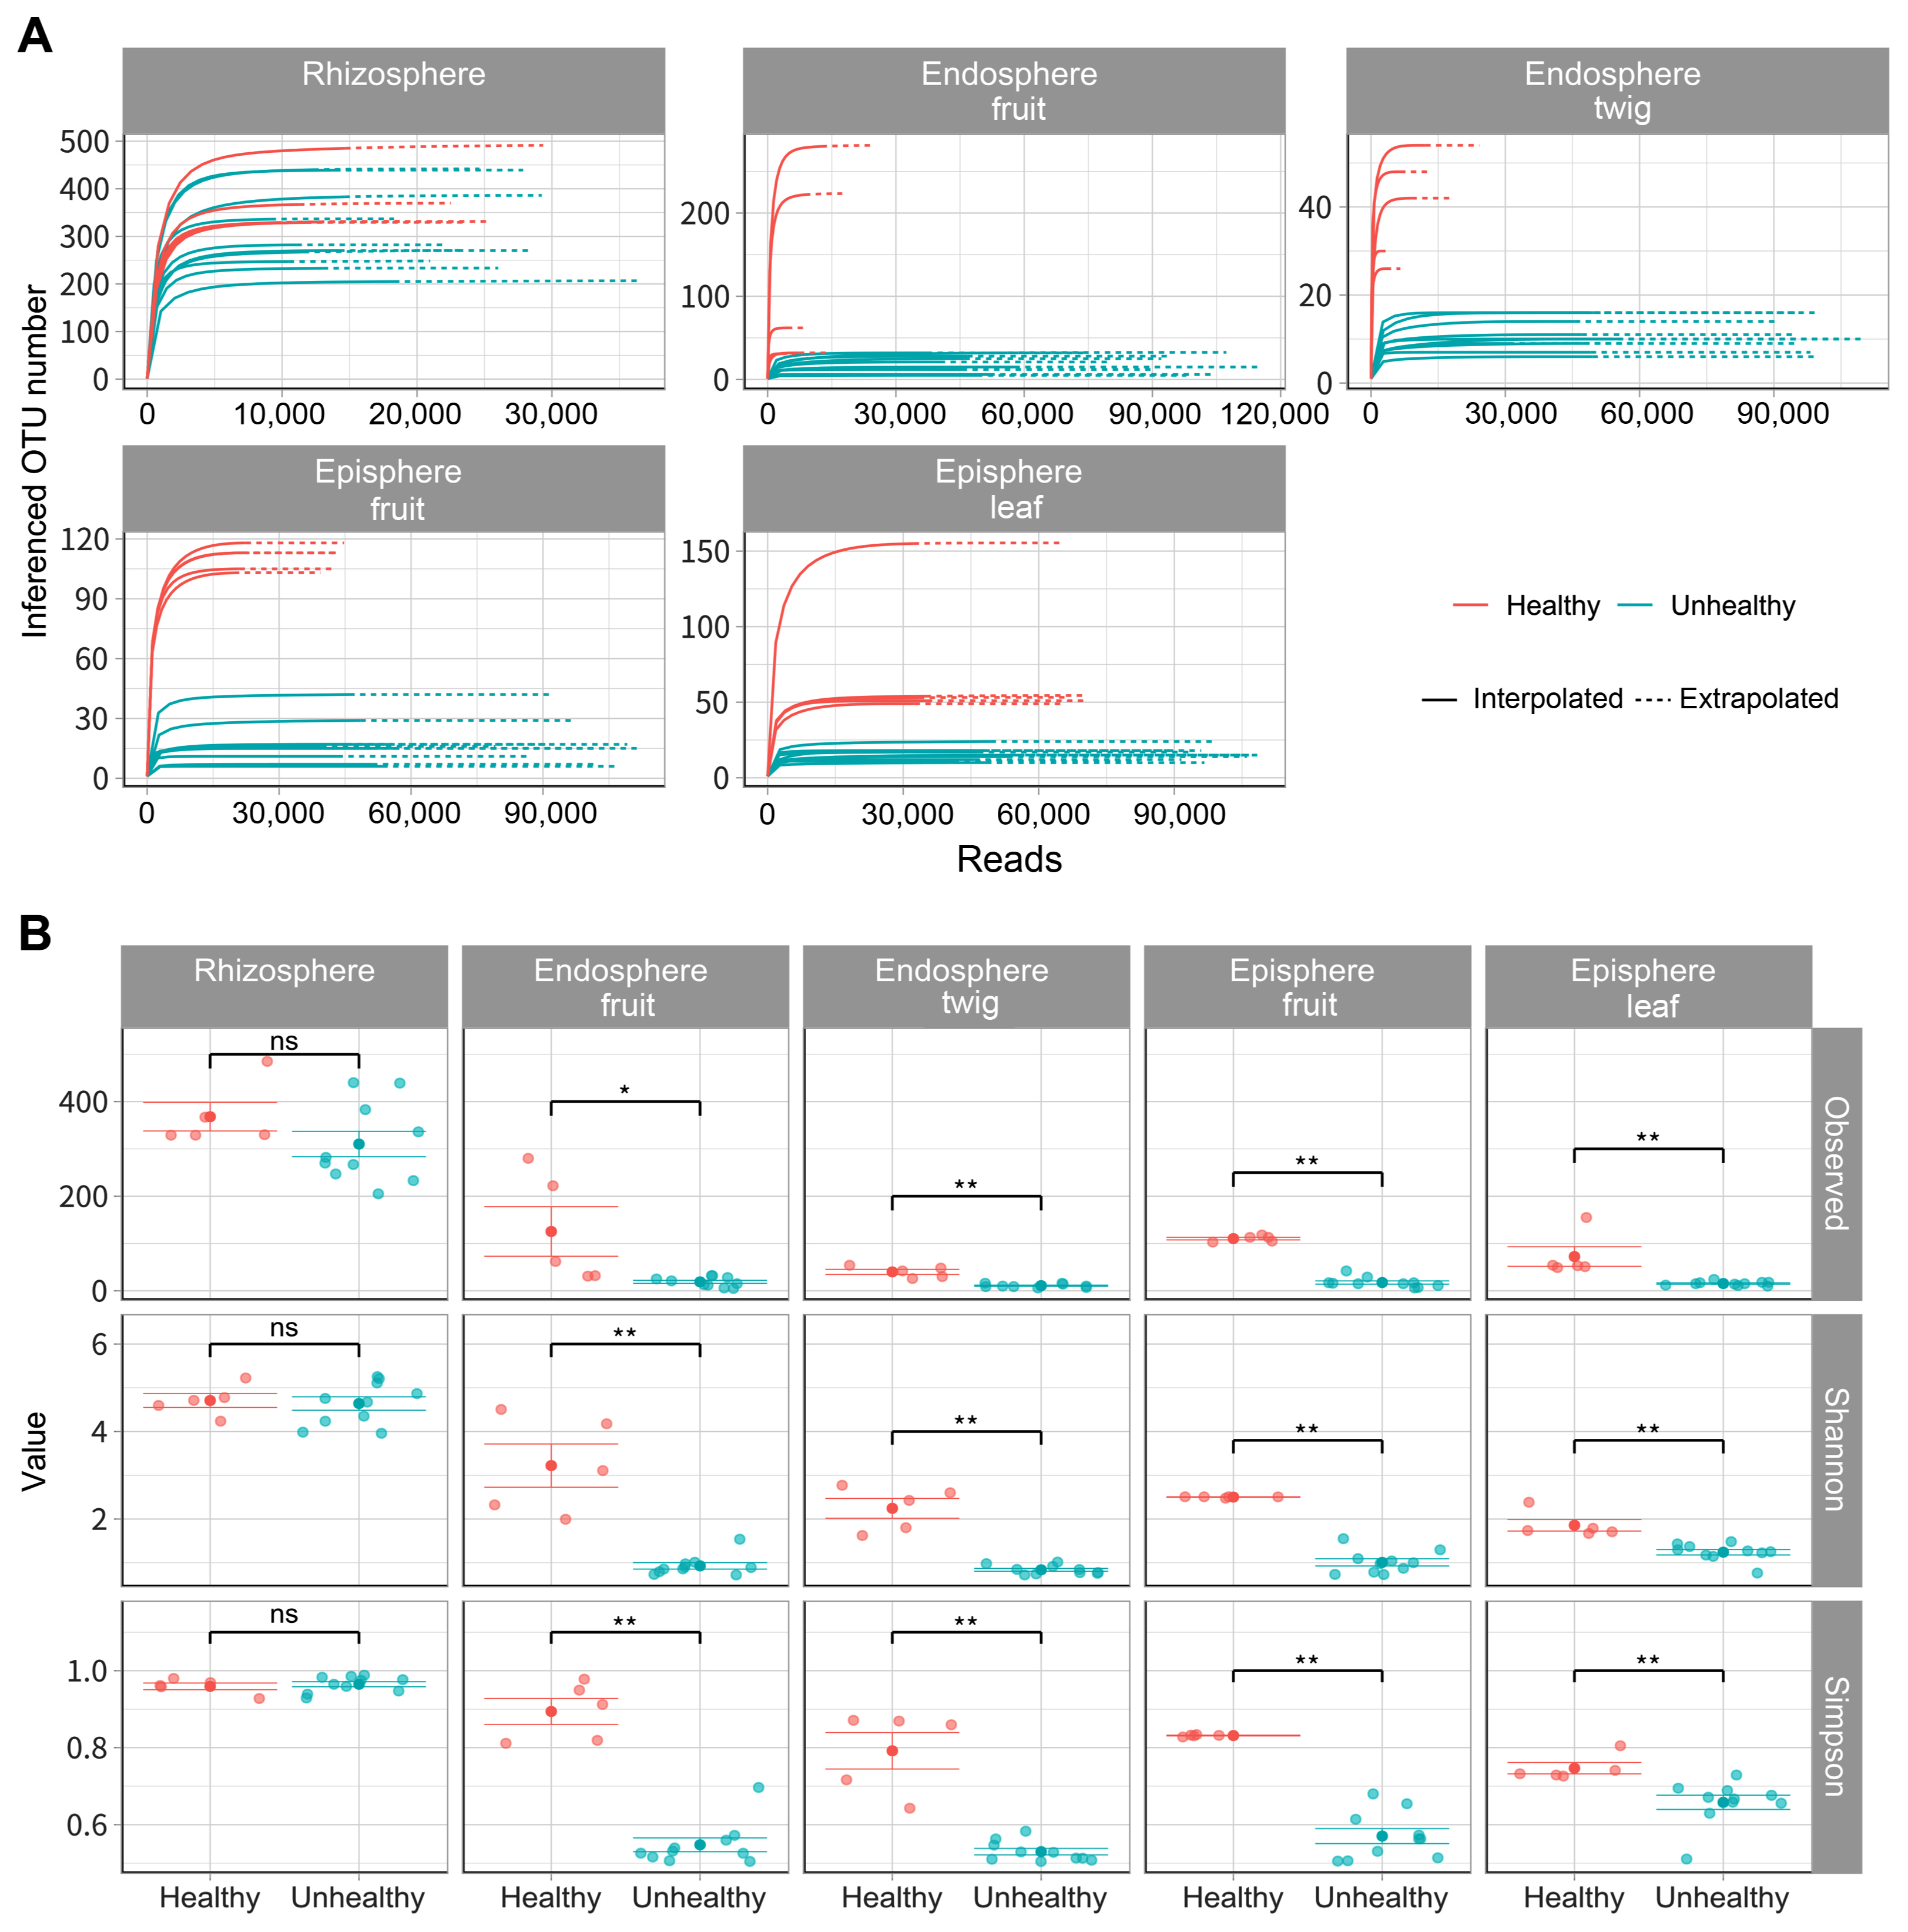
Species richness and diversity of fire blight infected and healthy apple. Operational taxonomic unit (OTU) was assigned by ID-TAXA that has been machine learned to confidence of identification with SILVA 138 SSU. All organization (rhizosphere, endosphere fruit, endosphere twig, episphere fruit, episphere leaf) were conducted in 5 replications. (A) Solid line appeared predicted values within the range of sample. Dotted line expected number of species undetected by the sampling effort. (B) Variables (observed, Shannon, and Simpson) were used to alpha diversity. Star indicate statistically significant differences (*P ≤ 0.05, **P ≤ 0.01) between infected and healthy apple trees by Kruskal-Wallis.
In the rhizosphere, healthy and infected trees had similar bacterial communities occupied by Pseudomonadaceae, Burkholderiaceae, Streptomycetaceae, and Gaiellaceae (Fig. 2A). Pseudomonadaceae comprised 7–36% of the rhizosphere. Gaiellaceae comprised to 1–16%. Burkholderiaceae and Streptomycetaceae dominated the range from 2% to 7%. In healthy trees endosphere fruit appeared composition of Pseudomonadaceae (8–35%), Burkolderiaceae (4–20%), and Oxalobacteraceae (0.7–28%). In endosphere twigs, Pseudomonadaceae (18–73%), Burkolderiaceae (2–26%), Oxalobacteraceae (3%–19%), and Beijerinckiaeceae (0.9–25%) were detected as abundant members. In episphere fruit, Pseudomonadaceae, Burkholderiaceae, Streptomycetaceae, and Enterobacteriaeceae was observed at 28–29%, 13%, 18–20%, and 8–9% abundance, respectively. In the diseased trees, Erwiniaceae constituted 61–99% in all tissue except the rhizosphere. Excluding Erwiniaceae from the community members, microbial relative abundance appeared from 0.05–32.42% in all areas except the rhizosphere (Supplementary Table 4). Rhizosphere communities showed no difference in composition whether E. amylovora infection was detected or not. A result of statistical significance through permutational analysis of variance analysis confirmed a value of Padj of 0.001 (Fig. 2B). Bacterial communities of endosphere and episphere in healthy trees from orchard C clearly confirmed the difference between fruit & twig and fruit & leaf. Through a result of difference in the bacterial community in healthy and unhealthy trees a significant difference (Padj = 0.045) was confirmed for endosphere (fruit, twig) and episphere (fruit, leaf) (Fig. 2B).
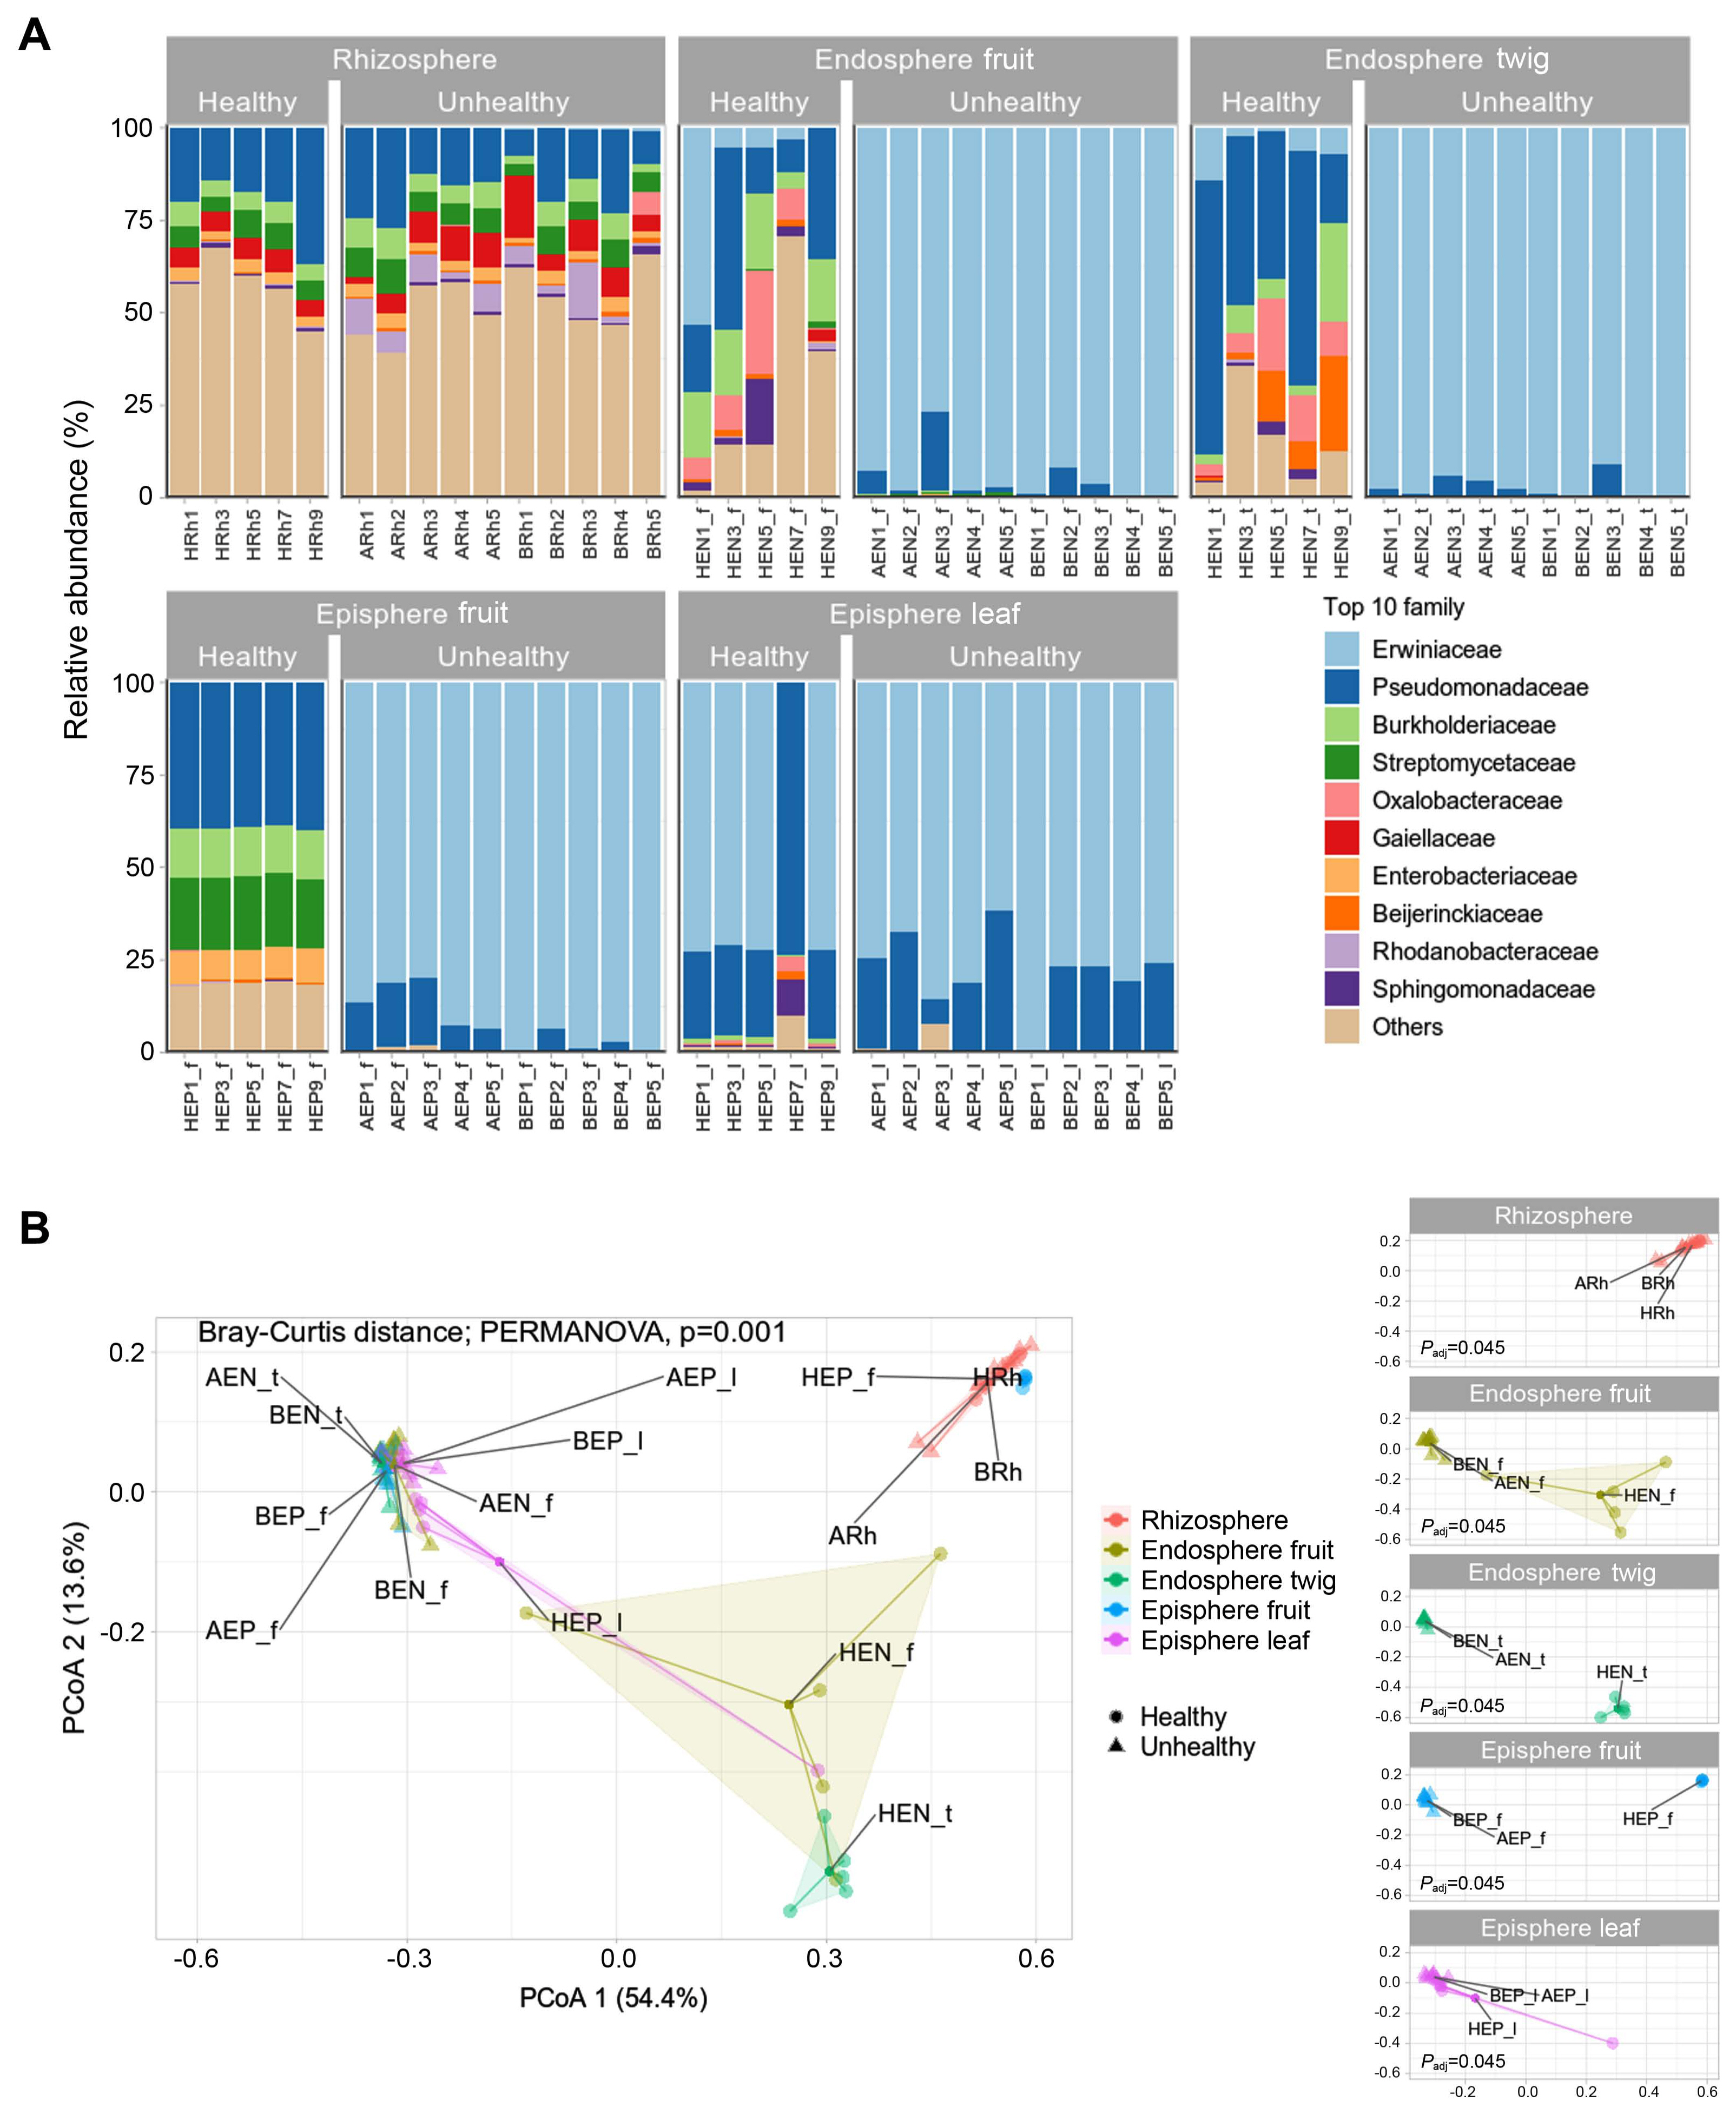
Diversity and difference of microbial community in healthy and fire blight infected apple. (A) Relative abundance in family level. Family level was cut off in top 10 taxa. (B) Principal coordinates analysis (PCoA) to visualize similarities or dissimilarities based on Bray-Curtis distance. Polygon zone is automatically enclosed points. Statistical analysis conducted by permutational analysis of variance and appeared significant difference between samples (P = 0.001). All samples were analyzed in 5 replicates.
Compared microbiota in healthy and E. amylovora infected trees had a 61–99% dominance in organization of unhealthy tree except rhizosphere. The bacterial communities were a difference in endosphere (fruit, twig), episphere (fruit), episphere (leaf). In healthy trees, endosphere showed a high ratio of Oxalobacteraceae and Beijerinckiaeceae, known as nitrogen fixation microbes. Beta diversity resulted in the absence of Erwiniaceae in rhizosphere and dominance of Erwiniaceae in endospheres and epispheres. In previous studies E. amylovora spread by rain, wind, insects, birds, and orchard workers (van der Zwet et al., 2012). It is known that flower is the primary entry route of E. amylovora into the host (Miller and Schroth, 1972). Our finding supports the previous study that E. amylovora infects and multiplies in the episphere of studied specimens. Microbiomes of healthy and unhealthy trees, as well as episphere communities, showed similar structures but there was a significant difference in PCoA (Padj = 0.045). This seems to be a difference because the diversity and richness of other bacteria are higher than those of infected trees.
Degree of metabolites related to gene expression of the presented bacteria community were predicted (Fig. 3). In healthy tree endospheres and epispheres, 13 pathways were upregulated and 11 pathways were identified (Table 1); toluene degradation III (aerobic) (via p-cresol), catechol degradation to 2-hydroxypentadienoate II, methylcatechol degradation, catechol degradation II, superpathway of salicylate degradation, catechol degradation I, D-galacturonate degradation I, superpathway of β-D-glucuronosides degradation, urea cycle, heme biosynthesis, L-isoleucine biosynthesis IV. Comparing pathways in the episphere of healthy and unhealthy trees, 8 metabolites pathways in unhealthy trees were detected as highly different (Table 2). Episphere of E. amylovora infected tree microbiomes showed the following metabolite pathways as upregulated; gallate degradation I, methylgallate-degradation, gallate degradation II, superpathway of (Kdo)2-lipid A biosynthesis, enterobacterial common antigen biosynthesis, hexitol fermentation to lactate, dTDP-N-acetylthomosamine biosynthesis, and superpathway of (R,R)-butanediol biosynthesis. Among the differently regulated pathways, hexitol fermentation to lactate, dTDP-N-acetylthomosamine biosynthesis, superpathway of (R,R)-butanediol biosynthesis are related to sucrose metabolites, which was reported to be important for host colonization of E. amylovora (Bogs and Geider et al., 2000; Koczan et al., 2009; Kube et al., 2010). Our research could be used to understand environment and control E. amylovora in the future.

Metabolite pathway expression in bacterial community confirmation using PICRUSt2 software version 2.3.0. The x-axis is the value substituted by log2. Blue dots indicate pathways that appeared more than log2 fold in the unhealthy group than in the healthy trees. Pink dot means that the pathways of healthy trees are more than log2 fold in unhealthy trees. Not significant dot group appear irrelevant pathway. It was considered that there is a statistical difference when the Padj value is less than 0.01.
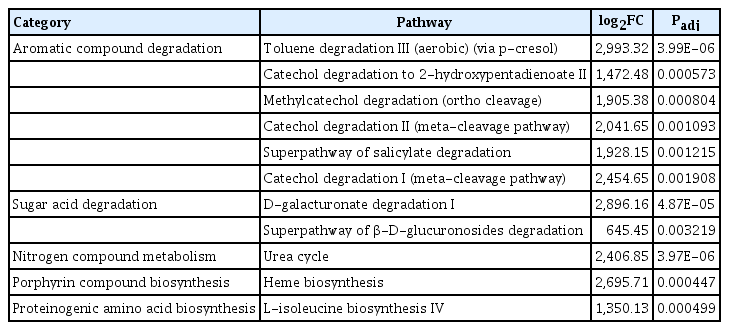
The common pathway at endosphere and episphere in healthy trees
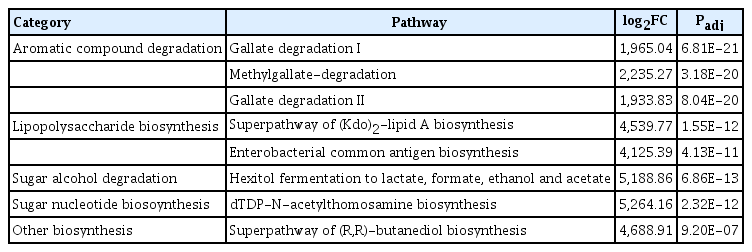
Pathway of episphere in unhealthy trees
Notes
Conflicts of Interest
Youn-Sig Kwak, a contributing editor of the Plant Pathology Journal, was not involved in the editorial evaluation or decision to publish this article. All remaining authors have declared no conflicts of interest.
Acknowledgments
This research was supported by the “Cooperative Research Program for Agriculture Science & Technology Development (PJ014934) from Rural Development Administration of Korea.
Electronic Supplementary Material
Supplementary materials are available at Journal of Pathology and Translational Medicine (https://jpatholtm.org).