DNA Damage Triggers the Activation of Immune Response to Viral Pathogens via Salicylic Acid in Plants
Article information

Abstract
Plants are challenged by various pathogens throughout their lives, such as bacteria, viruses, fungi, and insects; consequently, they have evolved several defense mechanisms. In addition, plants have developed localized and systematic immune responses due to biotic and abiotic stress exposure. Animals are known to activate DNA damage responses (DDRs) and DNA damage sensor immune signals in response to stress, and the process is well studied in animal systems. However, the links between stress perception and immune response through DDRs remain largely unknown in plants. To determine whether DDRs induce plant resistance to pathogens, Arabidopsis plants were treated with bleomycin, a DNA damage-inducing agent, and the replication levels of viral pathogens and growth of bacterial pathogens were determined. We observed that DDR-mediated resistance was specifically activated against viral pathogens, including turnip crinkle virus (TCV). DDR increased the expression level of pathogenesis-related (PR) genes and the total salicylic acid (SA) content and promoted mitogen-activated protein kinase signaling cascades, including the WRKY signaling pathway in Arabidopsis. Transcriptome analysis further revealed that defense-and SA-related genes were upregulated by DDR. The atm-2atr-2 double mutants were susceptible to TCV, indicating that the main DDR signaling pathway sensors play an important role in plant immune responses. In conclusion, DDRs activated basal immune responses to viral pathogens.
Multicellular organisms are continuously exposed to agents that can damage their DNA, both endogenously and exogenously, such as ionizing radiation (IR), ultraviolet (UV), reactive oxygen species (ROS), and the cell metabolism byproducts (Soria-Valles et al., 2017; Yoshiyama et al., 2020). DNA damage responses (DDRs) are conserved mechanisms that evolved to maintain eukaryotes’ DNA integrity. DDR cascades are activated by ataxia telangiectasia mutated (ATM) and ATM- and Rad3-related (ATR) proteins, which are DNA damage sensors and members of the phosphatidylinositol-3 kinase-like family that amplify and transmit signals to downstream components (Meek, 2009). ATM is primarily involved in double-strand breaks (DSBs), whereas ATR depends on the junctions of DNA single-strand breaks (SSBs) for activation. ATM and ATR are directly targeted and phosphorylated in mammalian cells by Chk1 and Chk2. ATM/ATR and Chk1/Chk2 also phosphorylate p53, an important effector involved in DDRs via cell cycle arrest, DNA repair, and apoptosis (Dai and Grant, 2010; Yoshiyama et al., 2014). In addition, plants have evolved animal-like DDR cascade, though the DDRs in plants are regulated by suppressor of gamma response 1 (SOG1), which is a member of the NAM, ATAF1/2, and CUC2 (NAC) protein family and share functional homology with p53 (Yoshiyama et al., 2014). SOG1 is a transcriptional activator and the central regulator of plant DDRs, controlling the expression of DNA repair, cell cycle checkpoints, programmed cell death, and endoreduplication (Bourbousse et al., 2018; Ogita et al., 2018). In animals, DDRs from low-dose irradiation are known to induce immune responses such as the stimulation of macrophage activity and proliferation of natural killer (NK) and T cells, leading to ROS and nitric oxide (NO) accumulation (Monaghan et al., 2009; Rubner et al., 2012). Moreover, radiation treatment (RT) induces immune responses directly to irradiated local tumors as well as non-irradiated anti-cancer sites (Rubner et al., 2012). Furthermore, p53 as a transcription factor in DDRs is involved in innate and adaptive responses through recognizing immune receptors and activating immune cells such as T cells, B cells, NK cells, and macrophages. The upregulation of p53 induces immune responses to viral pathogens. For example, mice with an extra copy of p53 gene show enhanced resistance to viral infections than p53-null mice (Lowe et al., 2013).
Like animals, plants have developed their innate immune systems to counter various pathogens. They can recognize microbe/pathogen-associated molecular patterns, such as bacterial flagellin, through pattern recognition receptors in plasma membranes, triggering PAMP-triggered immunity (PTI). PTI activates the basal immune system and subsequent plant defense responses; however, pathogen virulence effectors suppress PTI (Donze et al., 2014; Gao and He, 2013; Hu et al., 2012). Plants have evolved effector-triggered immunity (ETI), which recognizes pathogen effectors via intracellular nucleotide-binding/leucine-rich-repeat receptors. The activation of ETI can lead to a hypersensitive response (HR) that induces cell death around infection sites and increases the expression level of several defense genes, including the pathogenesis-related (PR) genes and the accumulation of salicylic acid (SA) in inoculated leaves (Betsuyaku et al., 2018; Chandra-Shekara et al., 2004). When plant innate immunity is activated in the infected tissues, migratory defense signals are transmitted to uninfected tissues, resulting in extensive and long-lasting resistance to pathogens, called systemic acquired resistance (SAR) (Cao et al., 1994; Jung et al., 2009; Uknes et al., 1992; Wang et al., 2014).
Turnip crinkle virus (TCV) is a small icosahedral virus with a single positive-strand RNA genome of 4.3 kb (Dempsey et al., 1997). Most Arabidopsis ecotypes are susceptible to TCV; however, line Di-17 of ecotype Dijon is resistant. Di-17 induces an HR against TCV inoculations, thus surrounding the lesions and restricting viral movement to other cells (Dempsey et al., 1993). HR induction is conferred by a single dominant gene termed HRT (HR to TCV), though recessive allele RRT (regulates resistance to TCV) is also required for TCV resistance (Dempsey et al., 1997; Kachroo et al., 2000). In contrast, the TCV-susceptible ecotype Columbia-0 (Col-0) fails to generate an HR response and has delayed and weak PR gene expression (Kachroo et al., 2000). TCV causes dropping bolts, crinkling of leaves, and stunted growth phenotypes in Col-0 (Jeong et al., 2008).
In plants, phytohormones are not only involved in growth and development, but they also influence plant-pathogen interactions. It is well established that SA, jasmonic acid (JA), and ethylene (ET) are involved in disease resistance. For example, SA induces resistance to the yellow leaf curl virus by regulating PR gene expression and defense-related enzyme activities in tomato (Li et al., 2019). Alginate oligosaccharide induces resistance to Pseudomonas syringae pv. tomato DC3000 (Pst DC3000) via an SA-mediated pathway in Arabidopsis (Zhang et al., 2019). JA also induces defense responses by triggering protective mechanisms in response to Pythium species in the soil (Vijayan et al., 1998). In addition, the overexpression of ethylene response factor 1 (ERF1) in Arabidopsis plants shows ET and JA-dependent defense responses to Fusarium oxysporum (Berrocal-Lobo and Molina, 2004). Abscisic acid (ABA) is thought to negatively regulate plant disease resistance; however, ABA confers resistance to Alternaria solani by upregulating ammonolyses and polyphenol oxidase activity (Song et al., 2011). Basal resistance against TCV is controlled predominantly by an SA-dependent pathway (Ton et al., 2002). SA is critical in activating disease resistance pathways against TCV in Arabidopsis (Chandra-Shekara et al., 2004).
The DDR and immune responses in plants have been studied in-depth; however, little is known about the orchestrated network with pathogen-derived molecules. Bacterial and fungal infections, as well as SA treatments, can increase the frequency of somatic homologous recombination DNA repair, indicating that DDRs and DNA repair are activated by biotic stresses and hormones (Lucht et al., 2002; Song and Bent, 2014). Tobacco and Arabidopsis plants infected with tobacco mosaic virus (TMV) or oilseed rape mosaic virus showed increased HR frequency (Kovalchuk et al., 2003; Yao et al., 2013). These studies indicate that DNA DSBs occur in host plant genomes in response to viral pathogen infections (Song and Bent, 2014). Among the Arabidopsis DDR components, the RAD51–BRCA2 complex is critical for DNA repair via HR and induces immune responses to bacterial pathogen infections by increasing the expression of PR-1 and restoring SAR (Durrant et al., 2007; Wang et al., 2010). Poly(ADP-ribose) polymerases (PARPs) are engaged in immune responses to bacterial pathogen infections. PARPs are DNA damage sensors that bind to DNA SSBs or DSBs and attract damage repair machinery. PARP2, rather than PARP1, has a role in basal defenses against bacterial pathogens (Song et al., 2015). The molecular mechanisms underlying the interactions between DDR signaling and immune responses to the viral pathogen are still elusive. This study was conducted to understand the molecular mechanisms of DDR-mediated immune responses using Arabidopsis-TCV as a pathosystem.
Materials and Methods
Plant growth conditions and chemical treatment
The seeds were sown on soil followed by cold treatment for 1 day to promote synchronized germination. After cold treatment, plants were grown at 22°C and 60% relative humidity under 16 h light and 8 h dark conditions. The seedlings were transplanted in plastic pots containing a sterilized mixture of vermiculite, perlite, and soil (1:1:9, v/v) on the 14th day after germination. Four-week-old plants were treated with water, bleomycin (BLM) (Sigma, St. Louis, MO, USA), or 100 μM BTH on foliar (Syngenta, Basel, Swiss). Plants treated with water were used as a negative control. The treated plants were kept for 24 h under optimal growth conditions.
Pathogen infection
TCV was synthesized using 6 μg of linearized pTCV66, T7 polymerase (Promega, Madison, WI, USA), 5× transcription buffer (Promega), 0.1M DTT, rNTPs (10 mM each), RNase inhibitor (Takara, Tokyo, Japan), and diethylpyrocarbonate (DEPC)-treated water. After incubation at 37°C for 1 h, RNA was purified with PCI (phenol:chloroform:isoamyl alcohol = 24:25:1) and precipitated with isopropanol. Viral RNA was resuspended in 2× inoculation buffer (pH 9.2) containing 50 mM glycine, 30 mM K2HPO4, 0.02% bentonite, and 1% celite. Next, the viral transcripts at 0.05 μg/μl concentration were inoculated on three leaves per plant. The TMV and cucumber mosaic virus (CMV)-Fny strain were maintained in our laboratory and multiplied in tobacco plants. All the viral strains were obtained from Professor Jing-Sung Hong at Kangwon national university. For pepper mottle virus (PepMoV) inoculation, Agrobacterium tumefaciens strain GV3101 expressing PepMoV-GFP was obtained from Professor Kook-Hyung Kim at Seoul National University. Agrobacterium was cultured in yeast extract peptone (YEP) broth containing 50 μg/ml of rifampicin and kanamycin and agroinfiltered in Nicotiana benthamiana plants. TMV, CMV, and PepMoV were extracted from virus-infected N. benthamiana leaves by homogenization in 0.2 g/ml of 50 mM phosphate buffer (pH 5.5) followed by centrifugation at 14,000 rpm for 5 min. The supernatant was used for the mechanical inoculation method. After inoculation, PepMoV-GFP was observed under UV light, and the GFP fluorescence was observed by Nightsea SFA light head BNC (NIGHTSEA, Lexington, MA, USA). The GFP-expressing plants were photographed with a Canon digital camera (EOS 100D, Tokyo, Japan).
The bacterial pathogens, Pst DC3000 was grown overnight in King’s B medium containing rifampicin (Sigma). The bacterial cells were harvested, washed, and suspended in 10 mM MgCl2. The cell suspension was diluted to a final density of 105 cfu/ml and infiltered using a needleless syringe into the adaxial surface of three leaves. Three leaf discs were collected and homogenized in 10 mM MgCl2, diluted 1,000-fold, and plated on King’s B medium. The plates were incubated at 30°C for 2 days; after that, the colonies were counted using the colony counter (Fisher Scientific, Waltham, MA, USA). SA-related Arabidopsis mutant seeds, including crp5-2, pad4-1, NahG, and sid2, were kindly provided by Prof. Pradeep Kachroo at the University of Kentucky. The atm-2 and atr-2 mutants seeds, associated with DNA damage signaling pathway, were kindly provided by Prof. Anne Britt at UC. Davis.
DNA extraction and polymerase chain reaction
Arabidopsis leaves were frozen in liquid nitrogen and homogenized in 150 μl of DNA extraction buffer (1 M Tris-base, 5 M NaCl, 0.5 M EDTA, and 20% sodium dodecyl sulfate). Then, 75 μl of PCI was mixed by vortexing, and the homogenate was centrifuged at 14,000 rpm for 10 min. The supernatant was mixed with isopropanol and centrifuged at 14,000 rpm for 10 min. The DNA pellet was washed in 70% ethanol and centrifuged at 14,000 rpm for 3 min. The DNA pellet was dried and dissolved in 30–50 μl distilled water. To analyze Arabidopsis genotypes, polymerase chain reaction (PCR) was performed on the extracted DNA samples using Taq polymerase (SmartGene, Daejeon, Korea). Gene-specific primers used for all PCR analyses are listed in Supplementary Table 1.
RNA extraction and quantitative real-time PCR
Arabidopsis leaves were frozen in liquid nitrogen and homogenized in TRIzol reagent (Invitrogen, Carlsbad, CA, USA). RNA pellet was dried and dissolved in 30 μl of DEPC water. RNA concentration was measured by nanodrop (Biochrom, Cambridge, UK). For cDNA synthesis, total RNA was denatured at 65°C followed by annealing at 37°C for 1 h with oligo dT16, 5× reaction buffer, dNTP (10 mM), and M-MLV RTase (Promega). cDNA and primers were mixed with Sybr Green Q-PCR Master MIX (SmartGene), and real-time PCR was performed using CFX Connect Real-Time PCR (Bio-Rad, Hercules, CA, USA). Gene-specific primers used for all PCR analyses are listed in Supplementary Table 1.
RNA-sequencing
Agilent 2100 Bioanalyzer (Agilent RNA 6000 Nano Kit, Agilent Technologies, Santa Clara, CA, USA) was used to evaluate RNA concentration and purity by measuring the 28S/18S ratio. cDNA was synthesized, and single-stranded DNA (ssDNA) was extracted for library construction. DNA nanoballs were generated with the ssDNA circle by rolling circle replication (PCR). Paired-end reads were generated on a BGISEQ-500 platform. The mapping of reads was conducted using HISAT.
Enzyme linked immuno-sorbent assay
Total proteins were extracted by homogenization in 100 mM carbonate buffer (3.03 g Na2CO3 and 6.0 g Na2HCO3), followed by centrifugation at 14,000 rpm for 10 min. The supernatant was transferred to a microtiter plate (Thermo Fisher Scientific, Waltham, MA, USA) and incubated for 1 h at 37°C. The plate was washed thrice using phosphate-buffered saline (pH 7.4) with 0.1% Tween 20 (PBS-T) buffer. Blocking buffer (0.5% bovine serum albumin [BSA] in phosphate buffered saline [PBS]) was added to the microplates and incubated for 1 h at 37°C. After incubation, the plate was washed thrice with PBS-T buffer. Primary antibody diluted 1:1,000 with 0.5% BSA in PBS was added to the plate and incubated for 4 h at 37°C. After incubation, the plate was washed thrice with PBS-T buffer. Goat anti-rabbit-alkaline phosphatase conjugate antibody diluted 1:1,000 with 0.5% BSA in PBS was added to the plate and incubated for 1 h at 37°C. Plates were washed thrice with PBS-T buffer, followed by adding 100 μl of p-nitrophenyl phosphate substrate (Sigma). The absorbance was measured at 405 nm on a Sunrise microplate reader (Tecan, Mannedorf, Swiss).
Total protein extraction and immunoblotting
For total protein extraction, plant leaves were homogenized in liquid nitrogen, and the protein extraction buffer (50 mM Tris-Cl [pH 7.5], 150 mM NaCl, 1 mM EDTA, 10% glycerol, 5 mM DTT, 0.5% Triton X-100, and protease inhibitor cocktail) was added to the homogenate. Protein concentration was determined using Bradford assay (Bio-Rad). Protein samples were separated using sodium dodecyl sulfate polyacrylamide gel (SDS-PAGE) and transferred to the PVDF membrane (Immobilon-P, Sigma) using Wet/Tank blotting systems (Bio-Rad). Anti-TCV-CP and anti-GFP (Abcam, Cambridge, UK) antibodies were diluted 1:1,000, while anti-rabbit IgG alkaline phosphatase (Sigma) and anti-mouse IgG alkaline phosphatase (Sigma) antibodies were diluted 1:10,000 and 1:5,000, respectively. Immunodetection was performed using NBT/BCIP substrate.
Histone protein extraction and immunoblotting
For histone protein extractions, 3 g of plant leaves were ground in liquid nitrogen and dissolved in 10 ml of nuclear isolation buffer (0.25 M sucrose, 60 mM KCl, 15 mM NaCl, 5 mM MgCl2, 1 mM CaCl2, 15 mM Pipes pH 6.8, 0.8% Triton X-100, and 1 mM phenylmethanesulfonylfluoride) supplemented with protease inhibitor cocktail and phosphatase inhibitor sodium ortho-vandate. After gentle mixing, the extract was filtered twice using a miracloth. Filtered plant extracts were centrifuged at 10,000 ×g for 20 min, and the pellet was resuspended in 0.4 M of H2SO4 for 1 h in ice. After centrifugation at 15,000 ×g for 5 min, the soluble protein in the supernatant was precipitated overnight using acetone at −20°C. After centrifugation at 7,000 ×g for 15 min., the pellet was resuspended in 4 M Urea. Protein concentration was measured using BCA assay (Thermo Fisher Scientific). Protein samples were subjected to SDS-PAGE, blotted, and immunodetected with rabbit anti-human γ-H2AX antibody at 1:1,000 dilution (Sigma).
Comet assay
About 100 mg of BLM-treated Col-0 plants were collected and gently sliced using the fresh blade in 300–400 μl PBS containing 10 mM EDTA on ice in the darkroom or in dim red light (Menke et al., 2001). The cell suspension was mixed with an equal volume of 1 % liquid low melting agarose and loaded onto a slide pre-coated with 1% normal melting agarose. The slide was soaked in unwinding buffer (0.3 M NaOH, 5 mM EDTA, pH 13.5) for 10 min at 4°C, and electrophoresis was performed for 10 min at 21 V in unwinding buffer. After electrophoresis, the slide was soaked in 1% Triton X-100 for 10 min to eliminate starch, followed by gradual soaking in 70% and 100% ethanol for 5 min. After drying, the glass slide was stained with 2.5 μg/ml of propidium iodide and observed under a fluorescence microscope (Olympus Optical Co. Ltd., Tokyo, Japan).
Hormone analysis
Hormone extraction and quantification assays were performed by the Center for Research Facilities in Gyeongsang national university. Briefly, 50 mg of BLM-treated leaves of Col-0 plants were freeze-dried (Samwon, Seoul, Korea) and homogenized by Tissuelyser II (Qiagen, Germantown, MD, USA). The extraction solvent was added to the homogenate, and the extract was analyzed using a high-throughput liquid chromatography method described by Pan et al. (2010) with some modifications. High performance liquid chromatography was run on 1260 series (Agilent Technologies) liquid chromatography system, and a C18 (4.6 × 50 mm, 3.5 μm) column (Agilent Technologies) was used for separation. Mass spectrometry was performed on an API 4000 mass spectrometer (SCIEX, Framingham, MA, USA) with negative and MRM modes. Equipment operation and data analysis were performed using BioAnalyst (version 1.6.1) and analyst software (version 1.6.1).
Statistical analysis
The significant differences were analyzed using the statistical and graphical functions of Excel (Microsoft, Redmond, VA, USA) and PASW Statistics 18 (SPSS, Chicago, IL, USA) tools. The statistical analyses were performed using a student’s t-test and one-way ANOVA. The significance value was set at *P ≤ 0.05, **P ≤ 0.01 in Excel, and P ≤ 0.05 in PASW statistics 18.
Results
DNA damage induced by BLM
BLM induces base damage, SSBs, and DSBs in DNA molecules. In response to DNA DSBs by ATM and ATR, the H2AX histone protein is phosphorylated on the 139th serine residue; therefore, γ-H2AX is a hall marker of DDR. Comet assays detect SSBs or DSBs via single-cell gel electrophoresis; because the damaged or fragmented DNA moves away from the nucleus during electrophoresis, they form a comet-like tail. To optimize the BLM concentration, Col-0 plants were treated with different concentrations of BLM (0, 1, 5, 12.5, and 50 μg/ml) and examined for γ-H2AX accumulation through western blotting using anti-γH2AX antibody to determine the DNA damage levels. The most effective BLM concentration was 12.5 μg/ml (Fig. 1A). More than 25 μg/ml of BLM causes visible damage on the leaves (data not shown). In addition, the comet assay showed that the DNA tails in the nuclei of the BLM-treated plants were longer than those of the water-treated plants (Fig. 1B). These results indicate that BLM treatment leads to the occurrence of DNA damage in Arabidopsis plants.
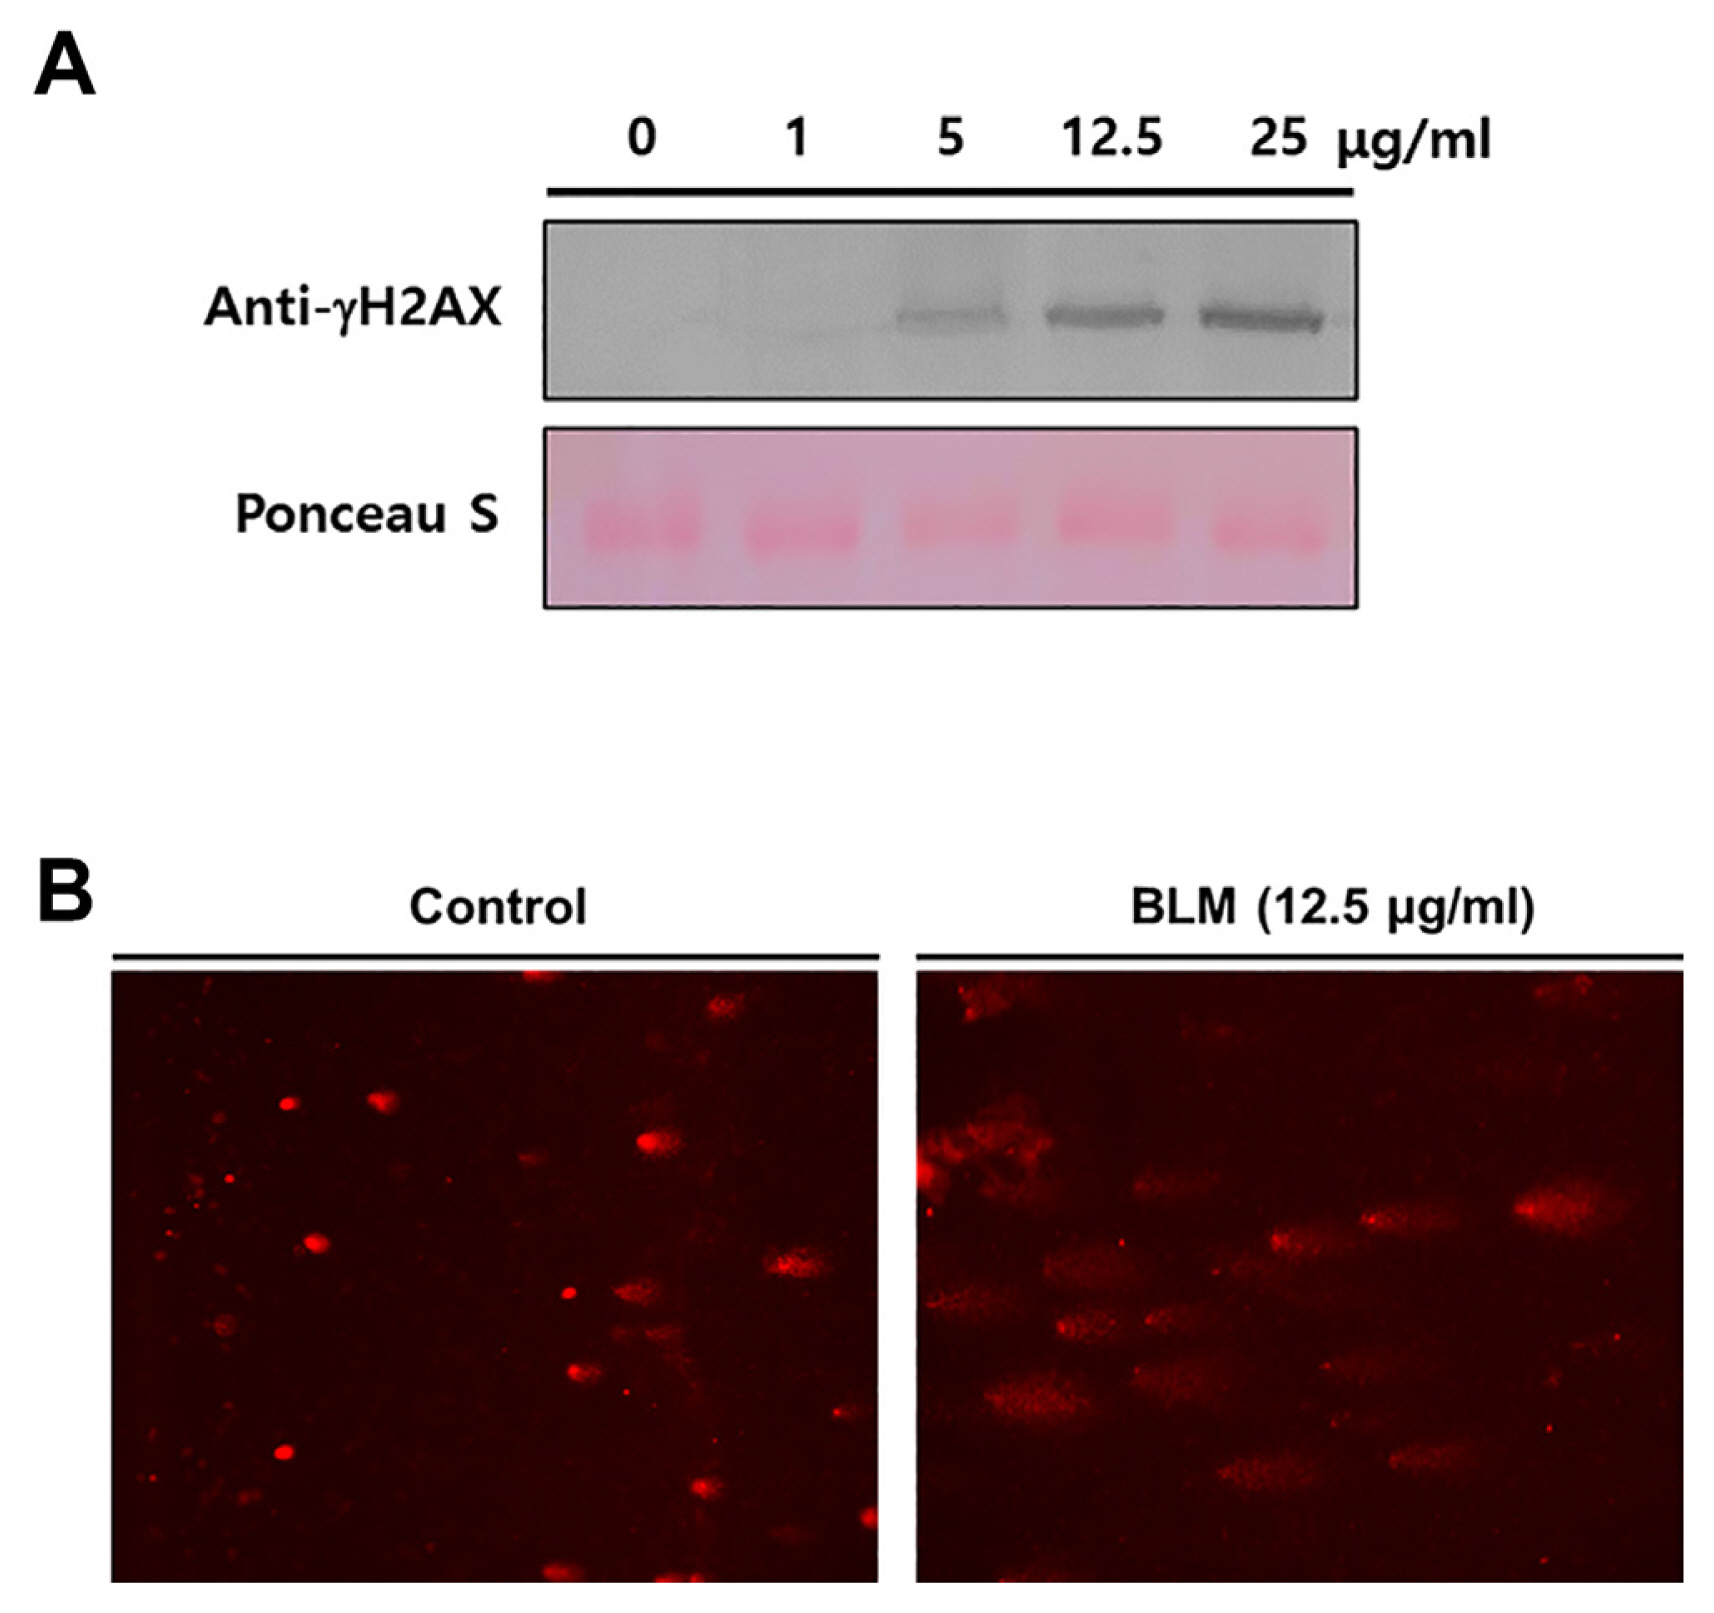
Bleomycin (BLM)-induced DNA damage response. (A) Col-0 plants were treated with 0, 1, 5, 12.5, and 25 μg/ml of BLM. The γ-H2AX level was determined at 1 day post-treatment (dpt) by immunoblot using an anti-γ-H2AX antibody. Equivalent loading of lanes was verified using Ponceau S stain. (B) Col-0 plants were treated with water or 12.5 μg/ml BLM. Samples were collected at 1 dpt. Representative BLM-induced DNA damage detected by an alkaline comet assay.
DNA damage induces disease resistance to TCV
To determine whether DNA damage following BLM treatment could induce immune responses in Arabidopsis plants, Col-0 plants were pretreated with water or BLM for 1 day. Next, three leaves of each plant were inoculated with TCV (Fig. 2). TCV replication levels were analyzed by immunoblotting using anti-TCV-CP antisera. The TCV-CP levels were significantly increased at 2- or 3-days post inoculation (dpi) in the water-treated plants and were more slightly accumulated in the BLM-treated plants (Fig. 2A). In addition, higher levels of TCV-CP were detected in the water-treated Col-0 plants than in the BLM-treated plants at 14 dpi (Fig. 2B). These observations correlated with enhanced disease resistance. Further, in comparison to the BLM-treated plants, the water-treated plants showed more severe stunting and drooping of the blots (Fig. 2C), suggesting that BLM induces disease resistance to TCV.
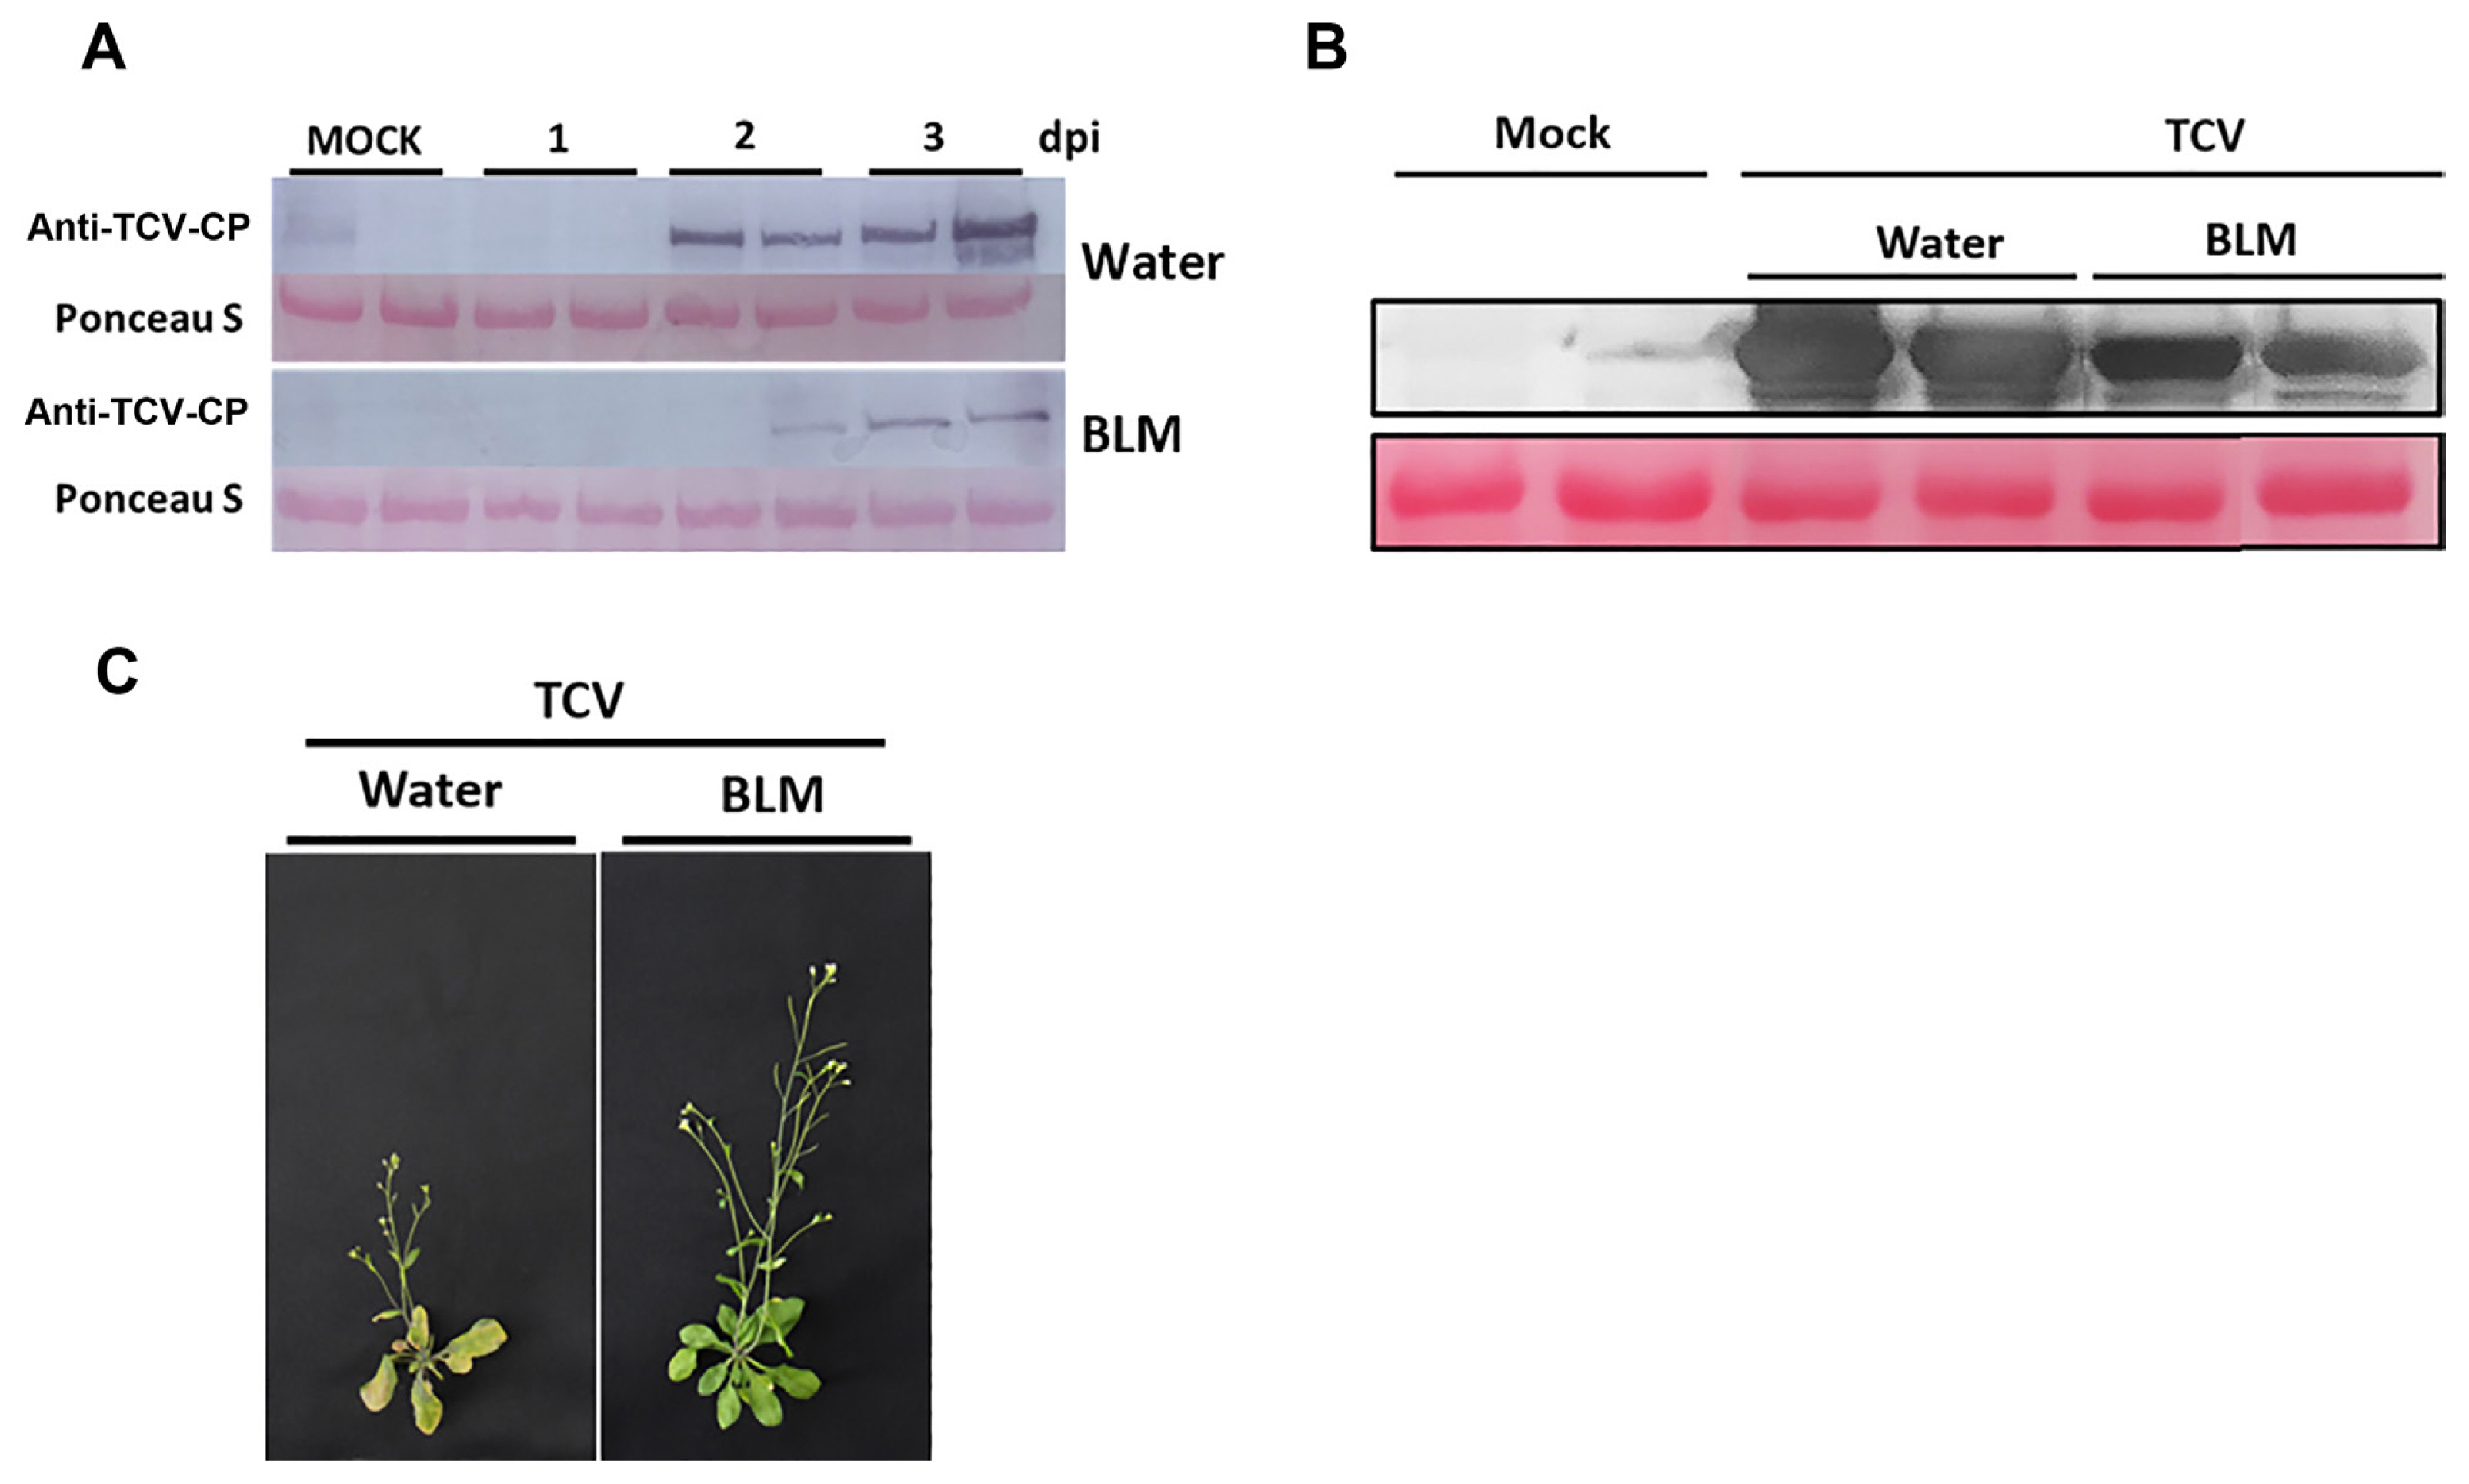
Basal resistance to turnip crinkle virus (TCV) induced by DNA damage. Five-week-old Col-0 plants were treated with water or bleomycin (BLM) for 1 day and then inoculated with TCV. (A) The level of TCV-CP was analyzed at 1, 2, and 3 days post inoculation (dpi) by immunoblot using anti-TCV-CP antibodies. Equivalent loading of lanes was verified using Ponceau S stain. (B) The level of TCV-CP was analyzed at 14 dpi by immunoblot using anti-TCV-CP antibodies. Equivalent loading of lanes was verified using Ponceau S stain. (C) Morphological phenotypes of TCV-inoculated water and BLM-treated Col-0 at 14 dpi. Both plants showed crinkling, stunted bolt development, and drooping of bolts.
DNA damage induces a defense response to other viral pathogens
To further confirm that DNA damage following BLM treatment induces immune responses to other viral pathogens, the CMV and TMV replication levels were determined in water or BLM-treated Arabidopsis leaves. The effects of DNA damage on CMV and TMV infections were analyzed using quantitative reverse transcription polymerase chain reaction (RT-qPCR) with specific primer sets. The results showed that the expression of CMV-CP gene was 2.6-fold lower in BLM-treated plants than the water-treated plants at 3 dpi (Fig. 3A). Typical morphological phenotypes of CMV-infected local leaves was not critically different in water- and BLM-treated plants at 3 dpi; however, drooping and stunting of the bolting were observed in the water-treated plants at 14 dpi (Fig. 3B). The expression of TMV-CP gene was 11-fold lower in the BLM-treated plants than the water-treated plants at 3 dpi (Fig. 3C). The TMV-infected plants showed clear difference in the disease symptoms of the water- and BLM-treated plants at 14 dpi (Fig. 3D). These results suggest that DNA damage in response to exogenous BLM application induces disease resistance to CMV and TMV. In addition, N. benthamiana plants were pretreated with water or BLM for 1 day before the inoculation with PepMoV expressing GFP and monitored for viral accumulation and spread in local leaves. RT-qPCR determined viral accumulation with specific primers. PepMoV accumulation was significantly lower in BLM-treated local leaves than in the water-treated plants at 5 dpi (Fig. 3E). Furthermore, BLM-treated N. benthamiana plants showed significant inhibition of GFP fluorescence in local leaves at 5 dpi (Fig. 3F). Taken together, DDRs following exogenous BLM application were found to enhance N. benthamiana resistance to PepMoV.

Basal resistance to cucumber mosaic virus (CMV), tobacco mosaic virus (TMV), and pepper mottle virus (PepMoV) induced by DNA damage. Five-week-old Col-0 plants were treated with water or bleomycin (BLM) for 1 day and then inoculated with CMV (A, B) and TMV (C, D). The CMV and TMV replication levels were analyzed by quantitative reverse transcription polymerase chain reaction (RT-qPCR) using CP-specific primers. (E, F) Five-week-old Nicotiana benthamiana plants were pretreated with water or BLM for 1 day before PepMoV inoculation. Accumulation of PepMoV was analyzed by RT-qPCR using CP-specific primers at 5 days post inoculation (dpi). All data were measured using ACTIN2 as a reference gene. GFP fluorescence in the PepMoV-GFP-inoculated local leaves was analyzed at 5 dpi. Values were presented as mean ± standard deviation from three independent measurements. Asterisks indicate significant differences (*P < 0.05; **P < 0.01; Student’s t-test) compared to the water-treated control group. (B, D) Morphological phenotypes of CMV- and TMV-inoculated Col-0 were observed at 14 dpi.
DNA damage does not induce disease resistance to Pseudomonas syringae pv. DC3000
To further explore whether DNA damage confers immune responses to bacterial pathogens, Col-0 plants were pretreated with water and BLM before Pst DC3000 inoculation (Fig. 4). Normal phenotypes were observed at 3 dpi; however, severe disease symptoms were detected in response to Pst DC3000 in both water- and BLM-treated plants at 7 dpi (Fig. 4A). The growth of Pst DC3000 was similar in water- and BLM-treated Col-0 plants at 3 dpi. (Fig. 4B). Taken together, we suggest that DNA damage induces plant immune responses to viral pathogens, including TCV, CMV, and TMV, though it does not trigger such responses against Pst DC3000 infection.

Basal resistance to Pseudomonas syringae pv. tomato DC3000 (Pst DC3000) induced by DNA damage. Five-week-old Col-0 plants were treated with water or bleomycin (BLM), then 1 × 10⁵ cfu/ml of Pst DC3000 and Pst DC3000 avrRpt2 were infiltrated after one day. (A) Leaves were photographed at 3 and 7 days post inoculation (dpi). (B) Growth of Pst DC3000 and Pst DC3000 avrRpt2 in water- or BLM-treated Col-0.
DNA damage induces the expression of immune response-related genes
To reveal the effects of DNA damage-induced immune response at the transcriptional level, RNA-sequencing of water- and BLM-treated Col-0 plants was performed (Fig. 5). Col-0 plants were treated with water (SRR23047916) or BLM (SRR23047917) for 1 day, and rosette leaves were collected for the total RNA extraction. A total of 6,259 differentially expressed genes (DEGs) were identified between the water- and BLM-treated Col-0 plants. Of these, 3,980 were upregulated, and 2,279 were downregulated in the BLM-treated Col-0 plants, according to gene expression level analysis with a log2 transformed fold change (Fig. 5A). Heat map analysis revealed the expression of DDR-responsive genes induced by BLM treatment (Fig. 5B). Gene ontology (GO) analysis was performed to classify the functions of DEGs and identify GO terms related to immune responses. Among the GO terms, immune system processes were enriched in the biological processes (Fig. 5C). In addition, Kyoto Encyclopedia of Genes and Genomes (KEGG) enrichment analysis revealed that the highly enriched pathways were associated with mitogen-activated protein kinase (MAPK) signaling and plant-pathogen interactions (Fig. 5D). These results indicate that DDRs in response to BLM treatment induces an orchestrated network of immune responses in plants.
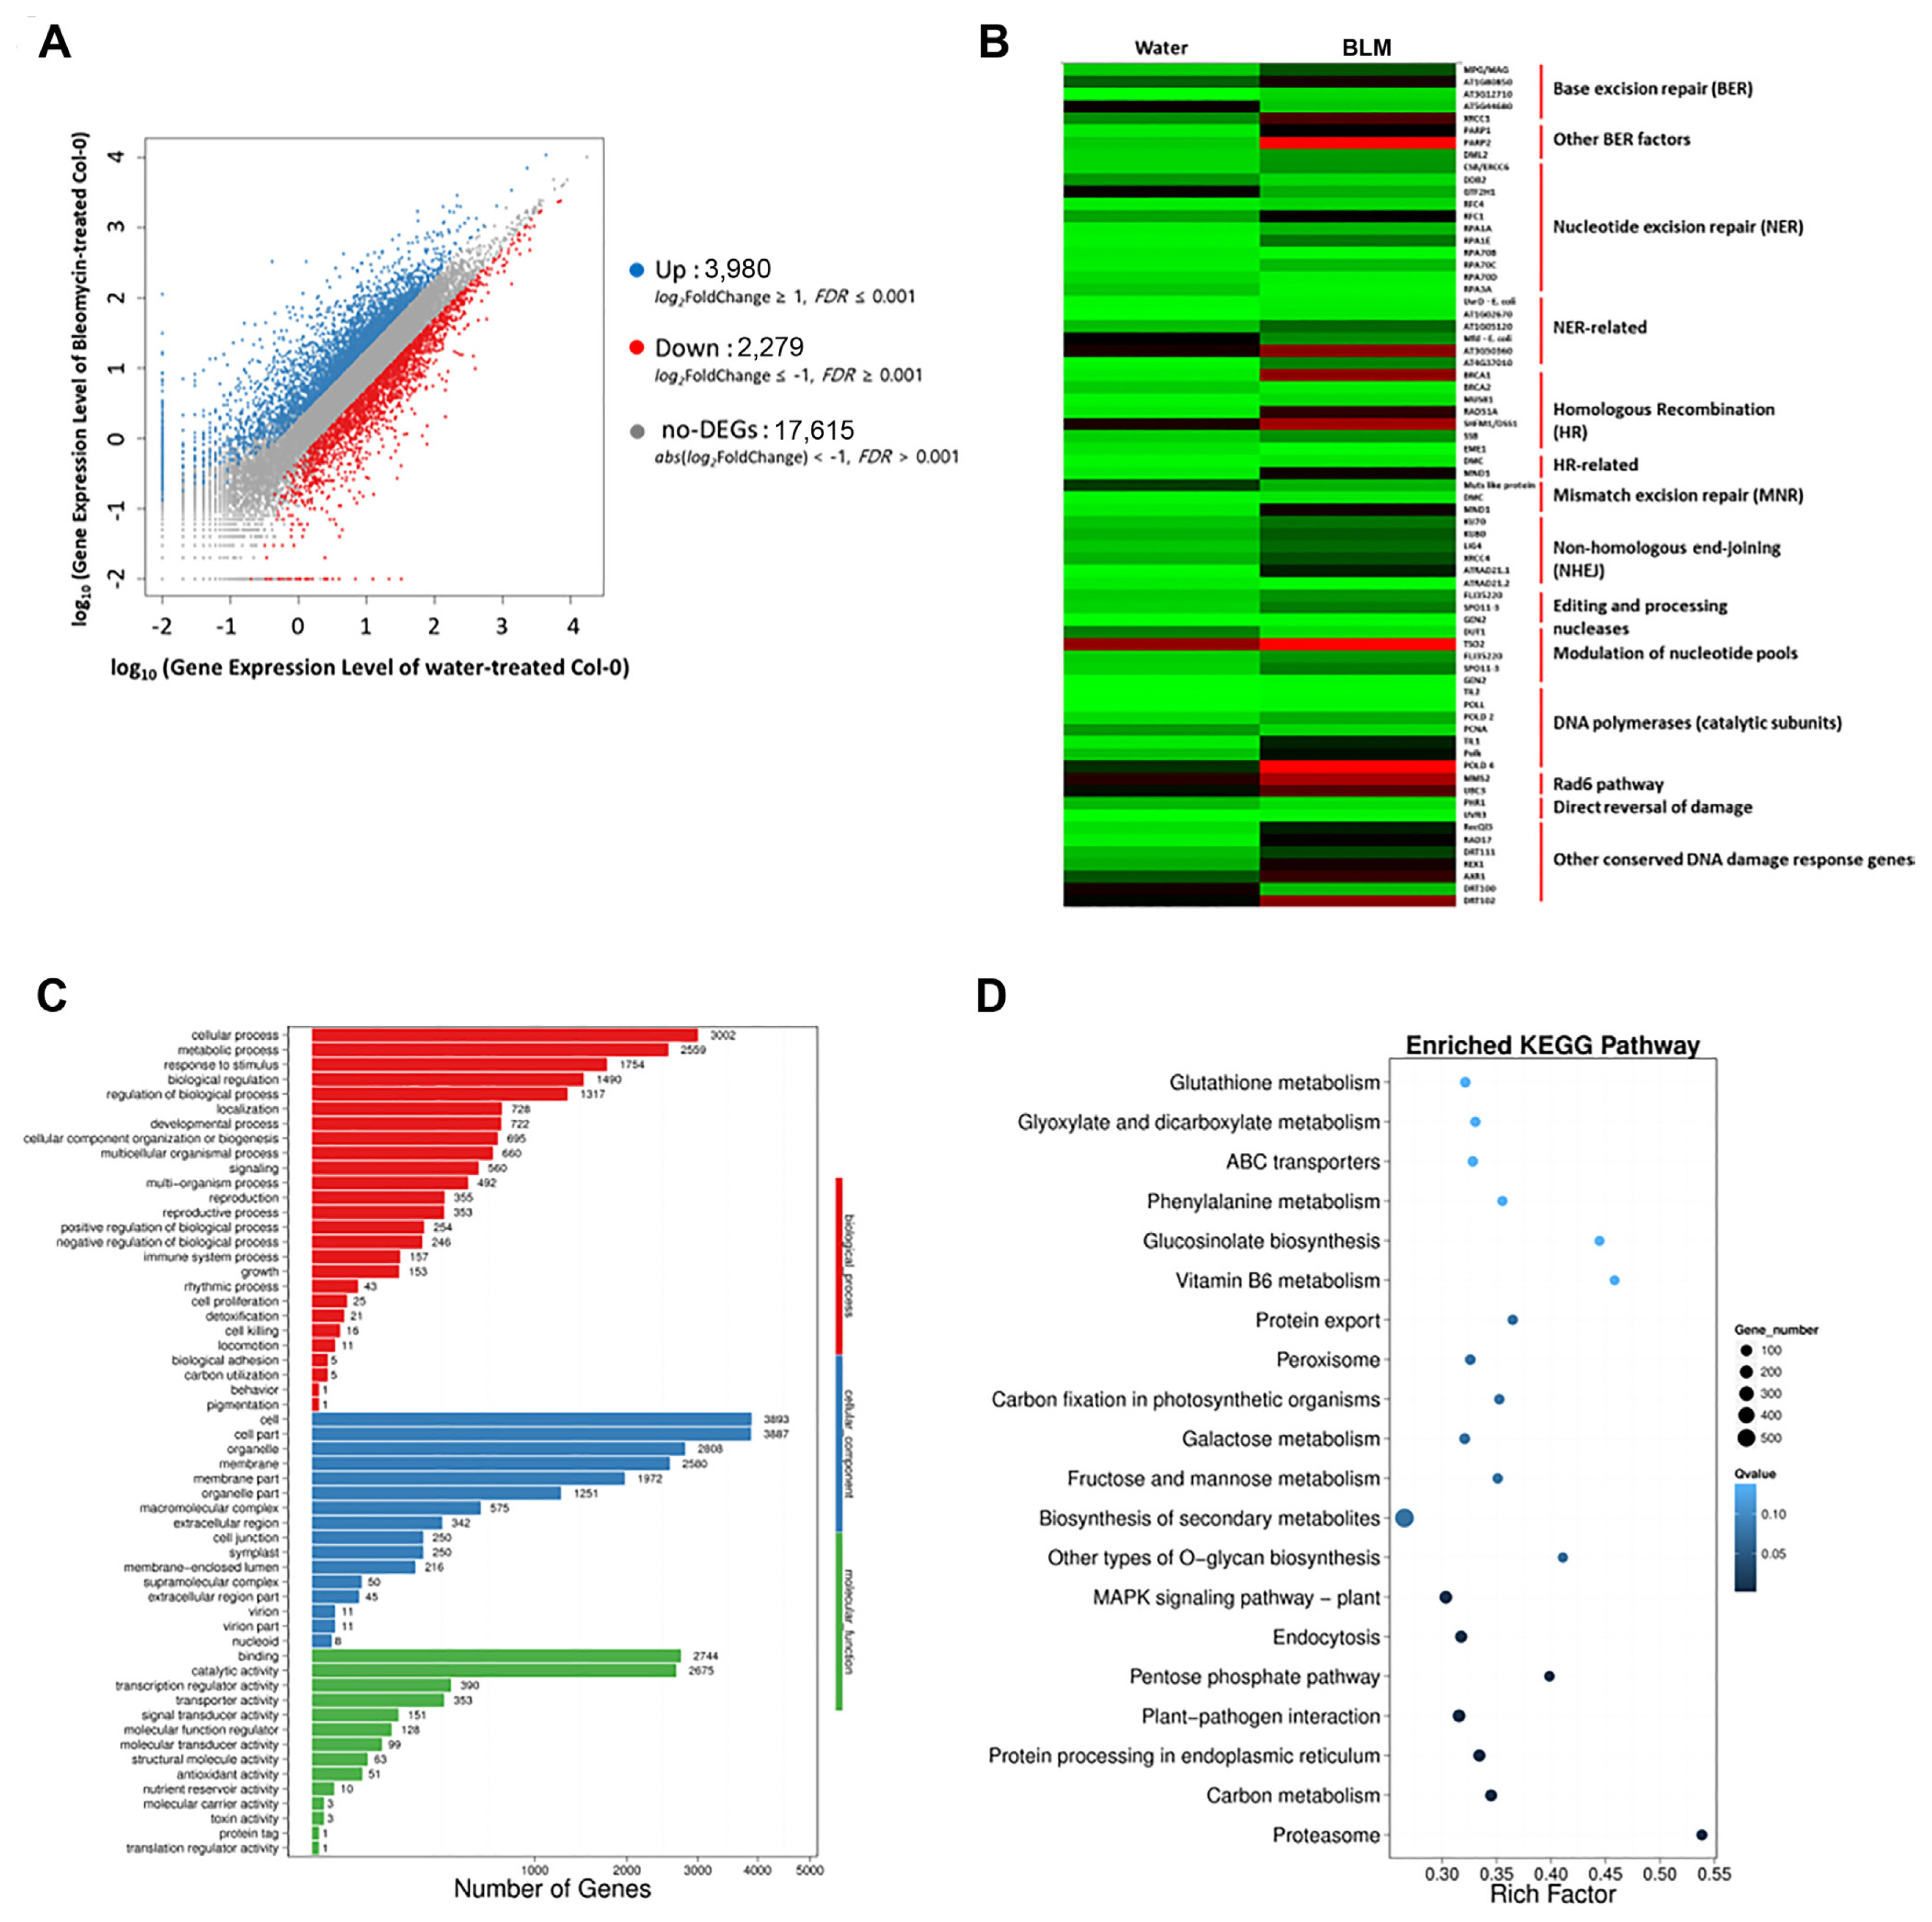
RNA-sequencing analysis of water- and bleomycin (BLM)-treated Col-0. (A) Scatter plot of differentially expressed genes (DEGs) showing DEGs in water- and BLM-treated plants. (B) Heat map analysis of DNA damage response (DDR)-related genes in BLM-treated Col-0 plants. Green represents lower expression, while red represents higher expression of DEGs. (C) Gene Ontology (GO) classification of DEGs. (D) Kyoto Encyclopedia of Genes and Genomes pathway classification and functional enrichment analyses of DEGs.
BLM treatment induces DDR marker genes
The expression levels of DDR marker genes in BLM-treated Col-0 plants were validated by RT-qPCR (Supplementary Fig. 1). Expression levels of ATM and ATR, kinase proteins, showed no significant changes, whereas SOG1, a central DDR regulator and transcription factor in plants, was upregulated in the BLM-treated plants. BRCA1, RDA51, WEE1, and PARPs, involved in DNA damage repair, were upregulated in the BLM-treated plants, suggesting that DDR was activated by BLM.
DNA damage induces the expression of defense-related genes
Transcriptome data indicated the upregulation of many defense-related genes after BLM treatment (Supplementary Table 2). Interestingly, SA-related resistance genes, such as PR-1, EDS16, PBS3, and EDS1, were remarkably upregulated. To validate RNA-sequencing results, we conducted the expression analysis of several defense-related genes in BLM-treated plants by RT-qPCR (Fig. 6). PR-1, PR-2, and PR-5 were significantly upregulated in the BLM-treated plants. However, PDF1.2, the marker gene of jasmonate-dependent responses, was downregulated at 24 h (Fig. 6A). RPM1 and RPS2 with the corresponding R genes avrRpm1 and avrRpt2, were not induced in the water- or BLM-treated plants (Fig. 6B). To determine whether BLM-treated plants induced MAPK-mediated SA defense signaling, expression levels of MPK3, MPK6, WKRY28, WKRY30, and WKRY46 were also analyzed (Fig. 6C and D). After the BLM treatment, MPK3 and MPK6 were induced more than 2-fold. In addition, WRKY28, WRKY30, and WKRY46 were also significantly upregulated in the BLM-treated plants. These results suggest that the MAPK-WRKY pathway mediated the DDR-induced defense responses.
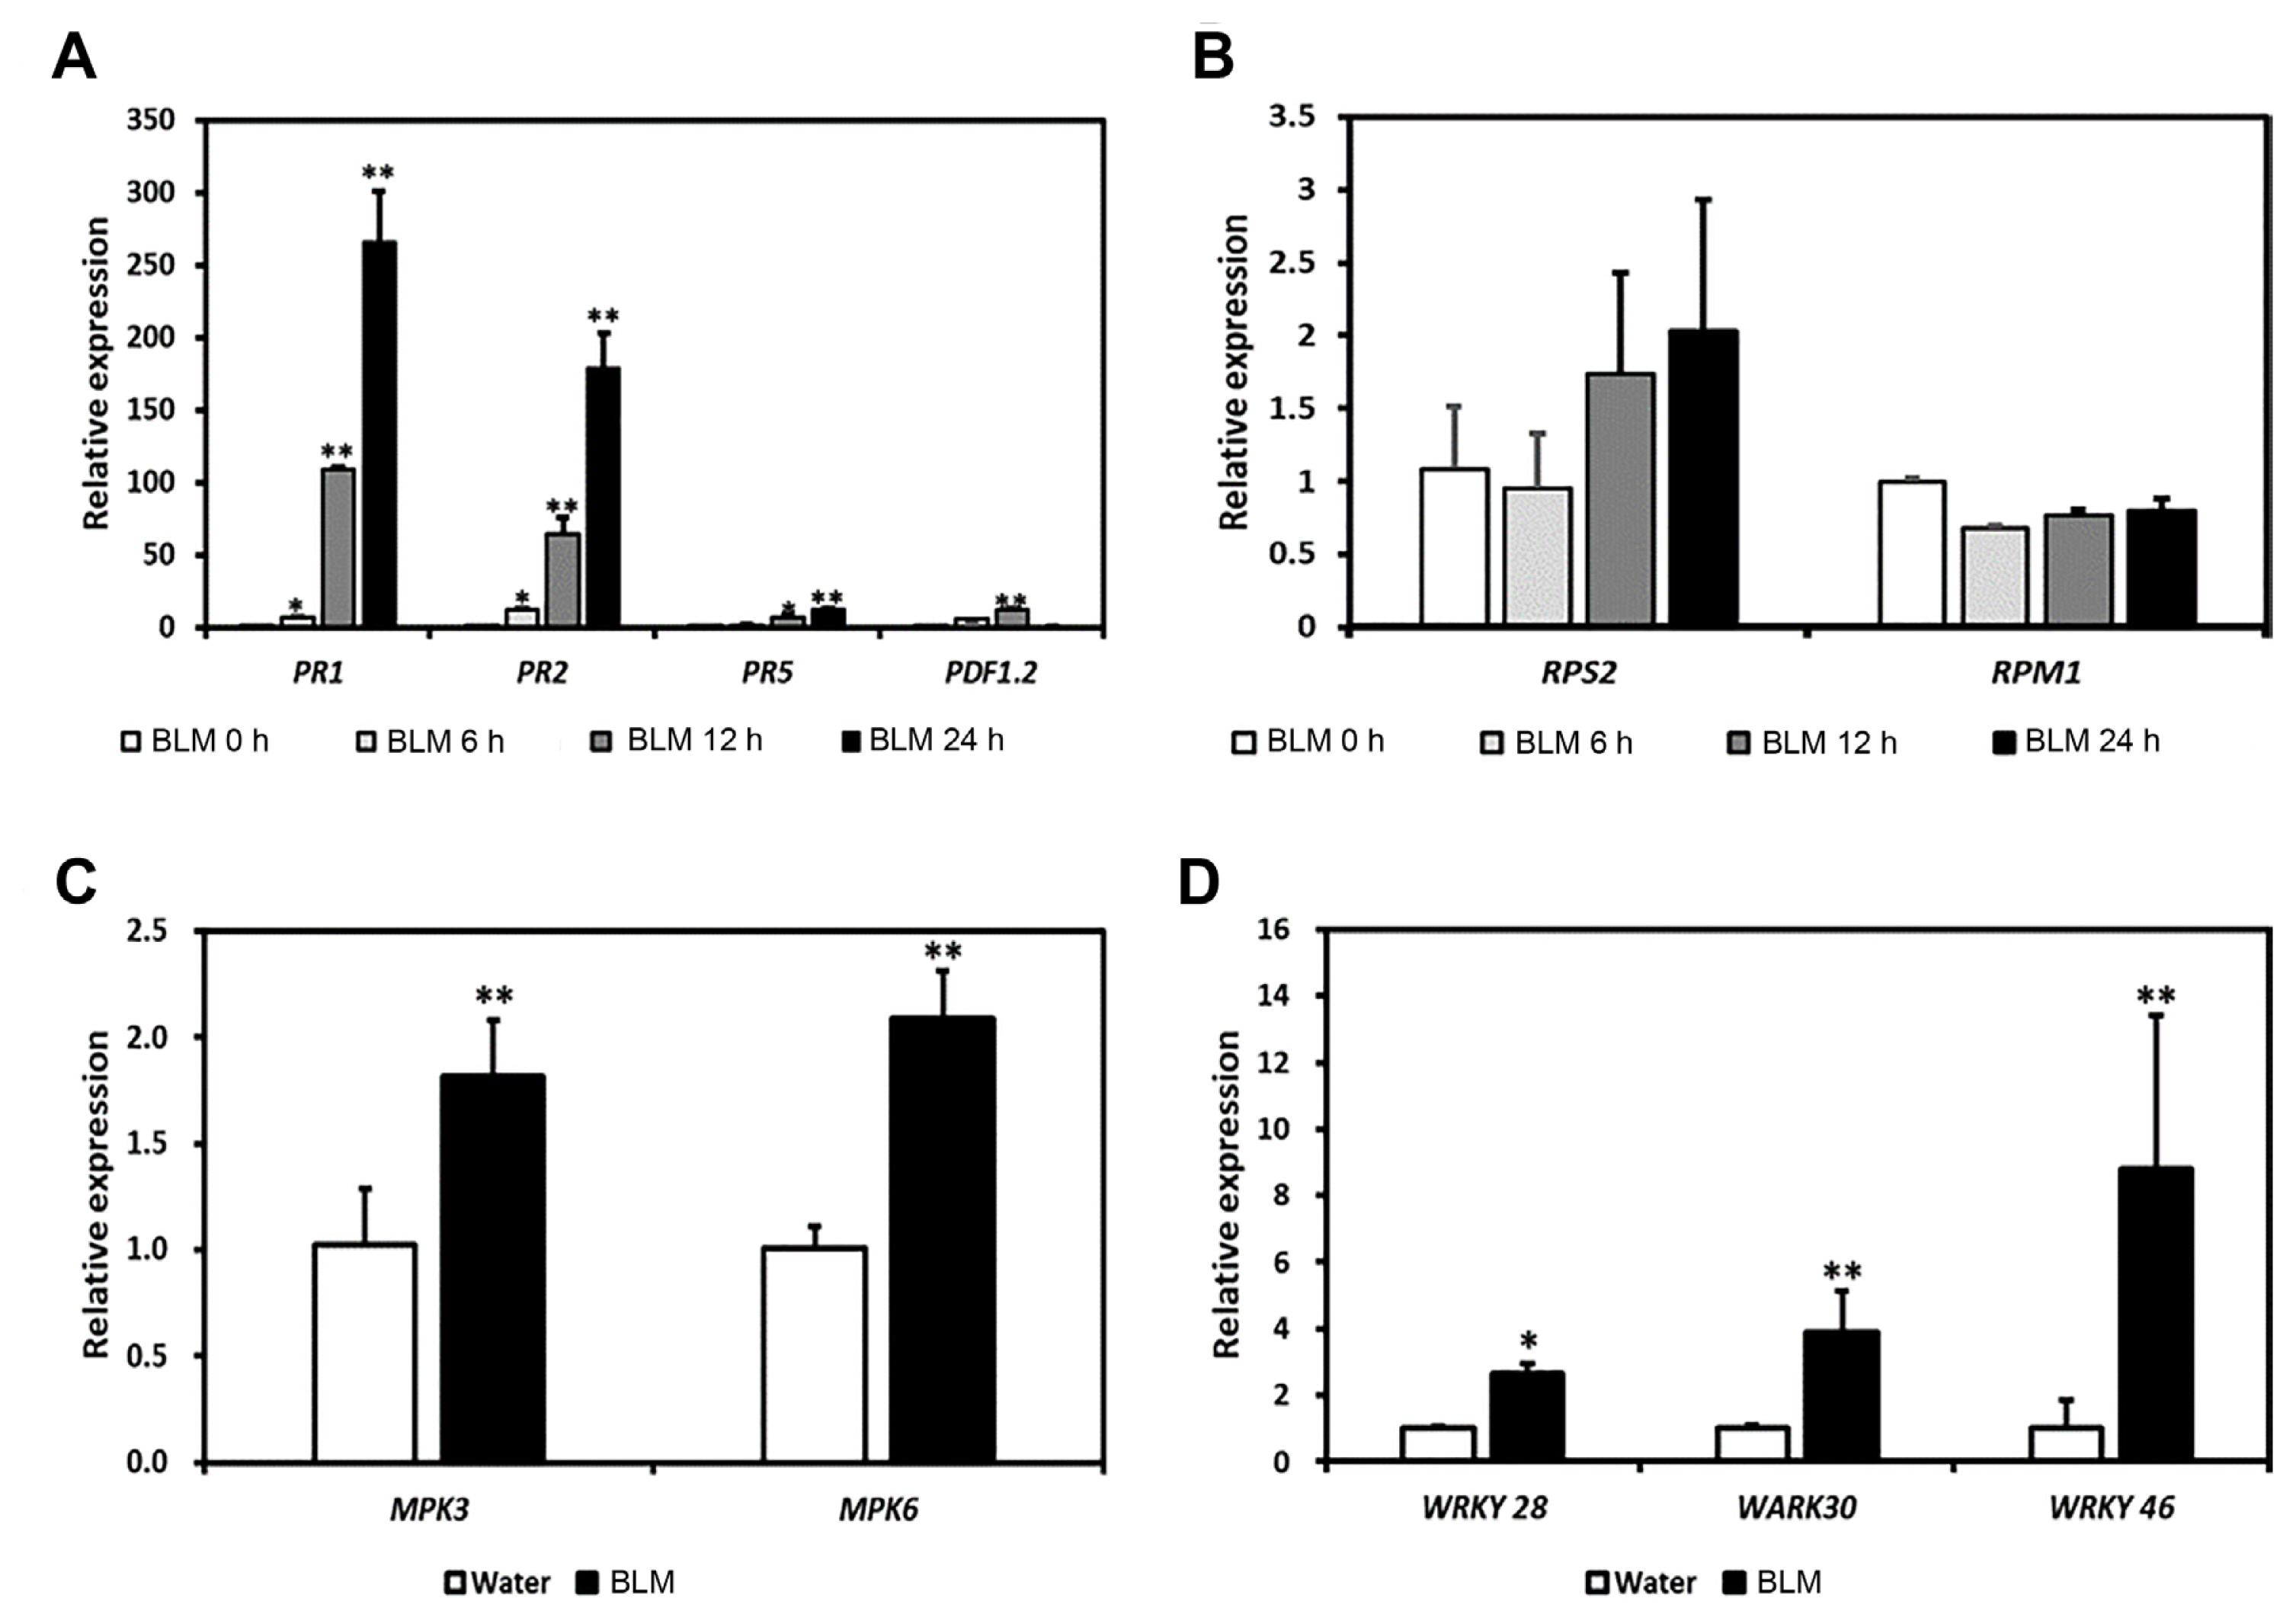
Expression level of defense-related genes in water- or bleomycin (BLM)-treated Col-0. Five-week-old Col-0 plants were treated with water or BLM for 1 day. The expression levels of defense-related genes (A), R gene-mediated defense genes (B), mitogen-activated protein kinase-related genes (C), and WRKY genes (D) were detected by quantitative reverse transcription polymerase chain reaction analysis at 1 day post-treatment (dpt). Values are presented as means ± standard deviation from three independent measurements. Asterisks indicate significant differences (*P < 0.05; **P < 0.01; Student’s t-test) compared to the water-treated control group.
DNA damage induces changes in SA levels
We analyzed plant hormone levels after water or BLM treatment to determine whether the hormone signaling is correlated with the increased immune response against the viral pathogens. BLM-treated plants showed a 4-fold increase in total SA content compared to the water-treated plants, although the level of the other hormones did not change significantly (Fig. 7A). To further explore whether the constitutively activated SA signaling in BLM-treated plants boosts the immune response to pathogens, the expression levels of SA-related genes were analyzed. RNA-sequencing analysis identified 51 SA-related genes in the BLM-treated plants, of which 44 were upregulated, while 7 were downregulated (Fig. 7B). The expression of SID2, PAD4, EDS5, and NPR1 was significantly enhanced in BLM-treated plants, indicating the correspondence of SA-dependent signaling pathway to defense response. As expected, these genes were also upregulated in BTH-treated plants, which served as a positive control (Fig. 7C).
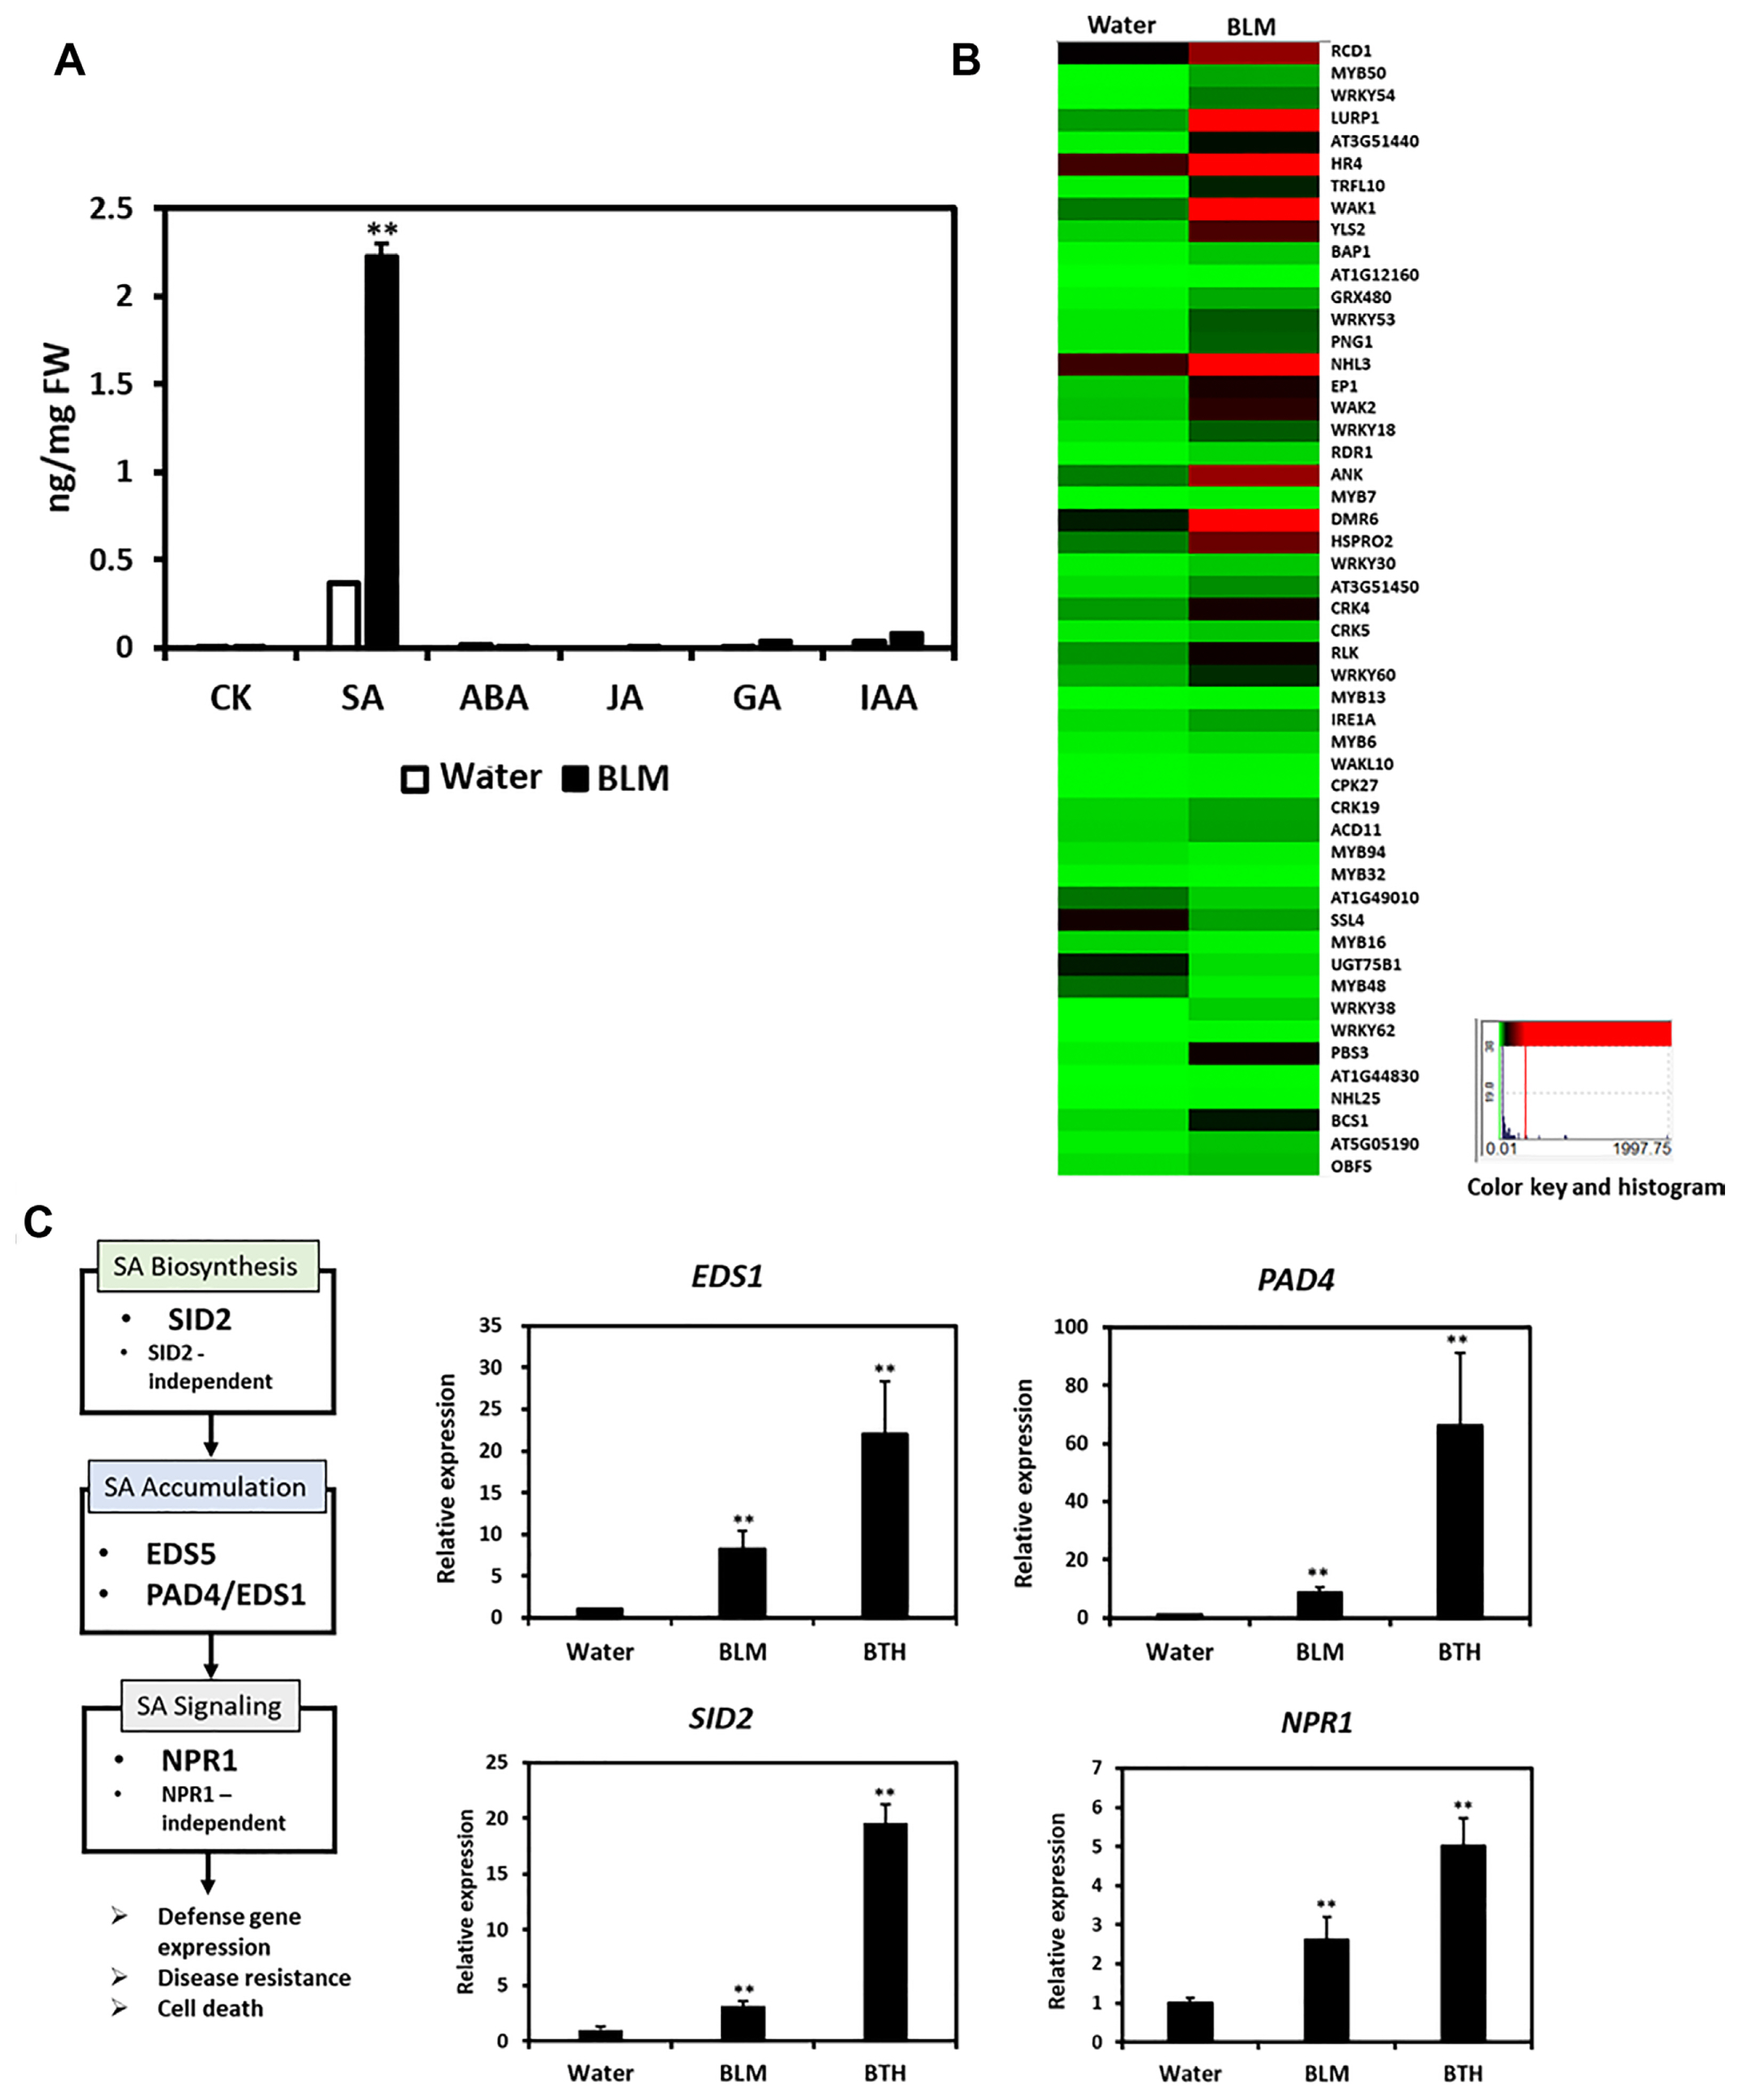
Salicylic acid (SA) induction in the bleomycin (BLM)-treated Col-0. (A) Free SA levels in the water- or BLM-treated five-week-old Col-0 plants. (B) Heat map analysis of salicylic acid-related genes in wild-type Arabidopsis after BLM treatment. Green represents lower expression, while red represents higher expression of differentially expressed genes (DEGs). (C) The expression levels of SA biosynthesis, accumulation, and signaling-related genes were analyzed by quantitative reverse transcription polymerase chain reaction. CK, cytokinins; ABA, abscisic acid; JA, jasmonic acid; GA, gibberellic acid; IAA, indole-3-acetic acid; BTH, benzothiadiazole. Values are presented as mean ± standard deviation from three independent measurements. Asterisks indicate significant differences (*P < 0.05; **P < 0.01; Student’s t-test) compared to the water-treated control group.
SA is involved in DNA damage-mediated resistance to TCV in Arabidopsis
NahG transgenic plants and sid2 mutants with defective SA pathways were used to confirm the role of the SA signaling pathway in DDR-induced resistance to viral pathogens. NahG and sid2 plants were pretreated with water and BLM before TCV inoculation. The TCV-CP was highly accumulated at 3 dpi in the BLM-treated NahG and sid2 plants compared to Col-0 plants (Fig. 8A). TCV infection upregulated PR-1 expression in the water-treated plants by 1.62-fold compared to the mock plants at 3 dpi (Fig. 8B). In addition, the expression level of PR-1 was increased by more than 600-fold in the wild type (WT) plants inoculated with TCV 1 day after BLM treatment. However, the BLM treatment did not affect the PR-1 expression in response to TCV in the NahG and sid2 plants. The morphological phenotypes of TCV-inoculated WT, NahG, and sid2 showed severe infection symptoms such as crinkling and stunted bolt development at 14 dpi (Fig. 8C). These observations suggest that DNA damage-induced resistance to TCV was involved in SA synthesis and/or accumulation.
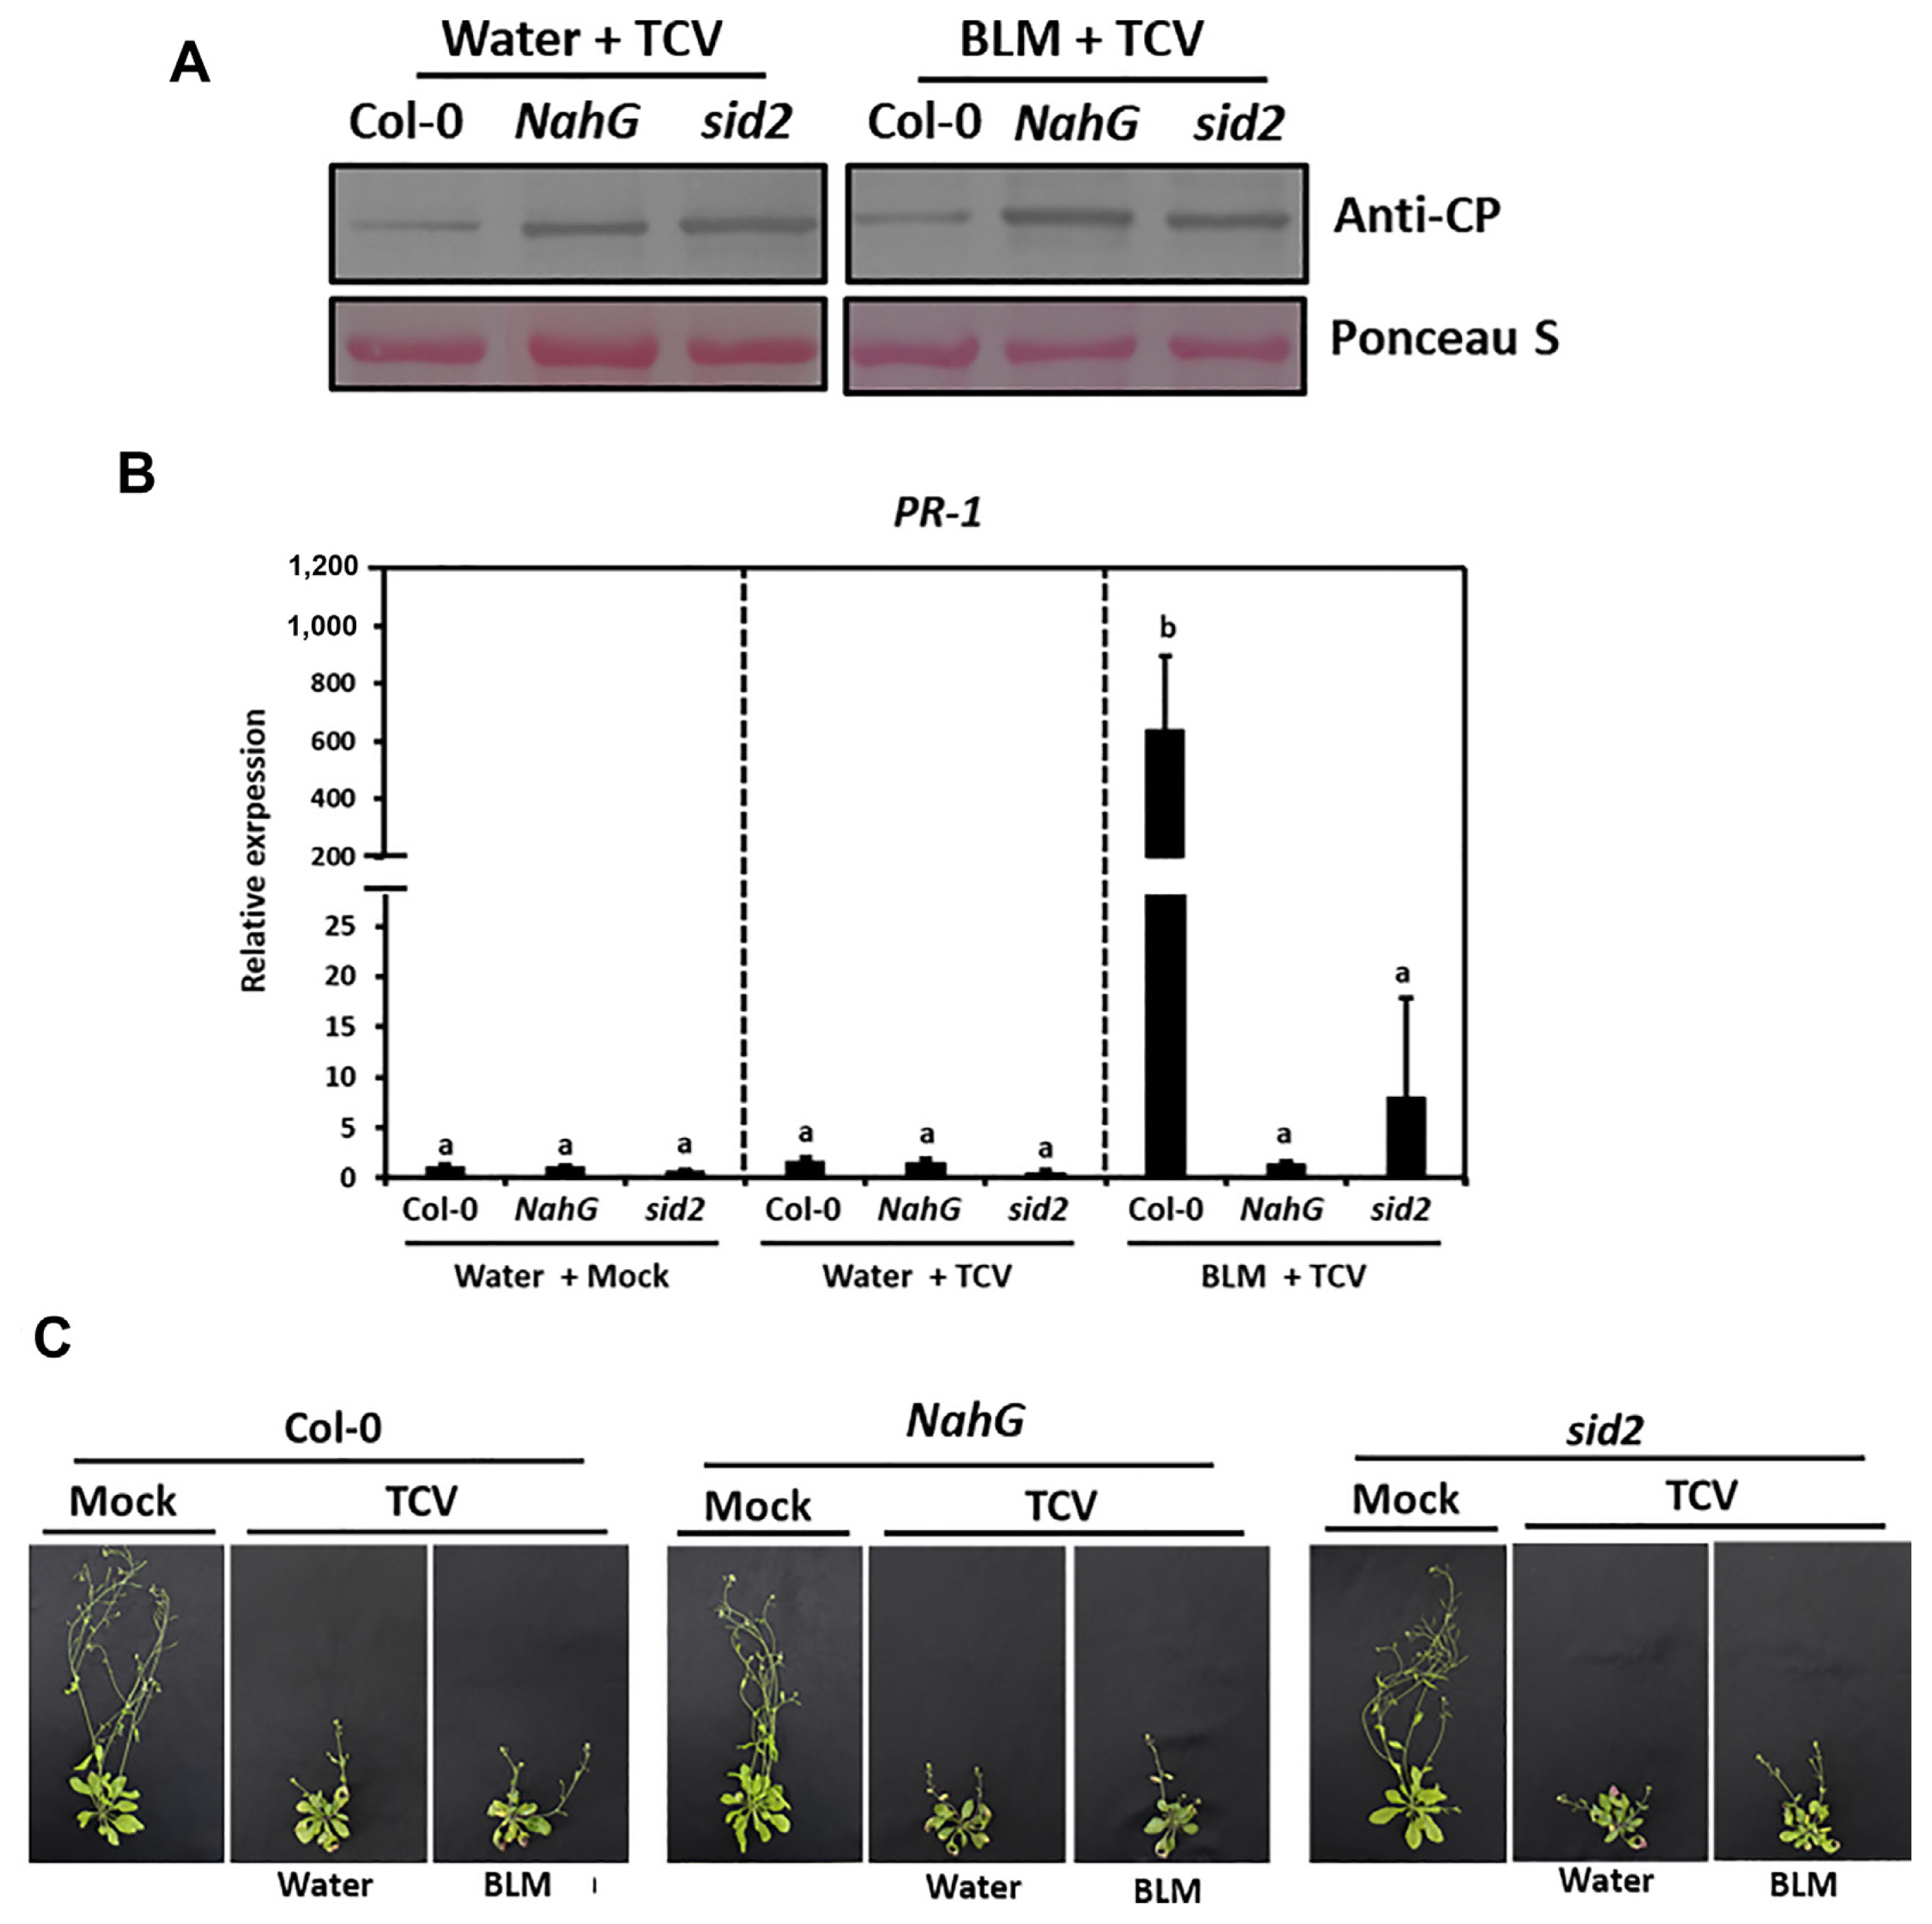
Salicylic acid (SA) involvement in DNA damage response-induced resistance to turnip crinkle virus (TCV). Col-0, NahG, and sid2 plants were treated with water or BLM and then inoculated with TCV. (A) TCV replication level in these plants was detected by western blot using anti-TCV-CP antibodies. Equivalent loading of lanes was verified using Ponceau S stain. (B) PR-1 gene expression level was analyzed by quantitative reverse transcription polymerase chain reaction. (C) Morphological phenotypes of mock and TCV-inoculated plants at 14 days post inoculation (dpi).
The constitutive expression of PR-5 mutants (cpr5-2) activates the SAR signaling pathway and PR-1 expression, resulting in increased disease resistance to pathogens (Bowling et al., 1997; Clarke et al., 2000). Moreover, the cpr5 mutants spontaneously form HR lesions by consistently inducing endogenous SA signals (Clarke et al., 2000). We determined whether constitutively increased endogenous SA concentration confers DNA damage and TCV resistance. The Col-0, cpr5-2, and pad4-1 plants were inoculated with TCV, and samples were collected at 3 dpi. The TCV-CP level was determined by enzyme linked immunosorbent assay (ELISA) using an anti-TCV-CP antibody. The pad4-1 plants, an SA signaling deficient mutant, showed high TCV-CP levels, whereas cpr5-2 plants showed its low levels compared to the WT plants (Fig. 9A). The expression of PR-1 gene was increased, leading to TCV resistance in cpr5-2 mutants (Fig. 9B and C). To determine whether endogenously accumulated SA in cpr5 confers DNA damage, the DDR marker genes were analyzed by qRT-PCR (Fig. 9D). In the cpr5-2 mutants, the PARP2 and RAD51 expressions were increased compared to the WT or pad4-1 plants. In addition, it was confirmed that DNA damage was induced even in the basal state of cpr5-2 through DSBs generation, observed by the detection of γ-H2AX (Fig. 9E). These results suggest that DNA damage-induced resistance to TCV was correlated with high SA accumulation.
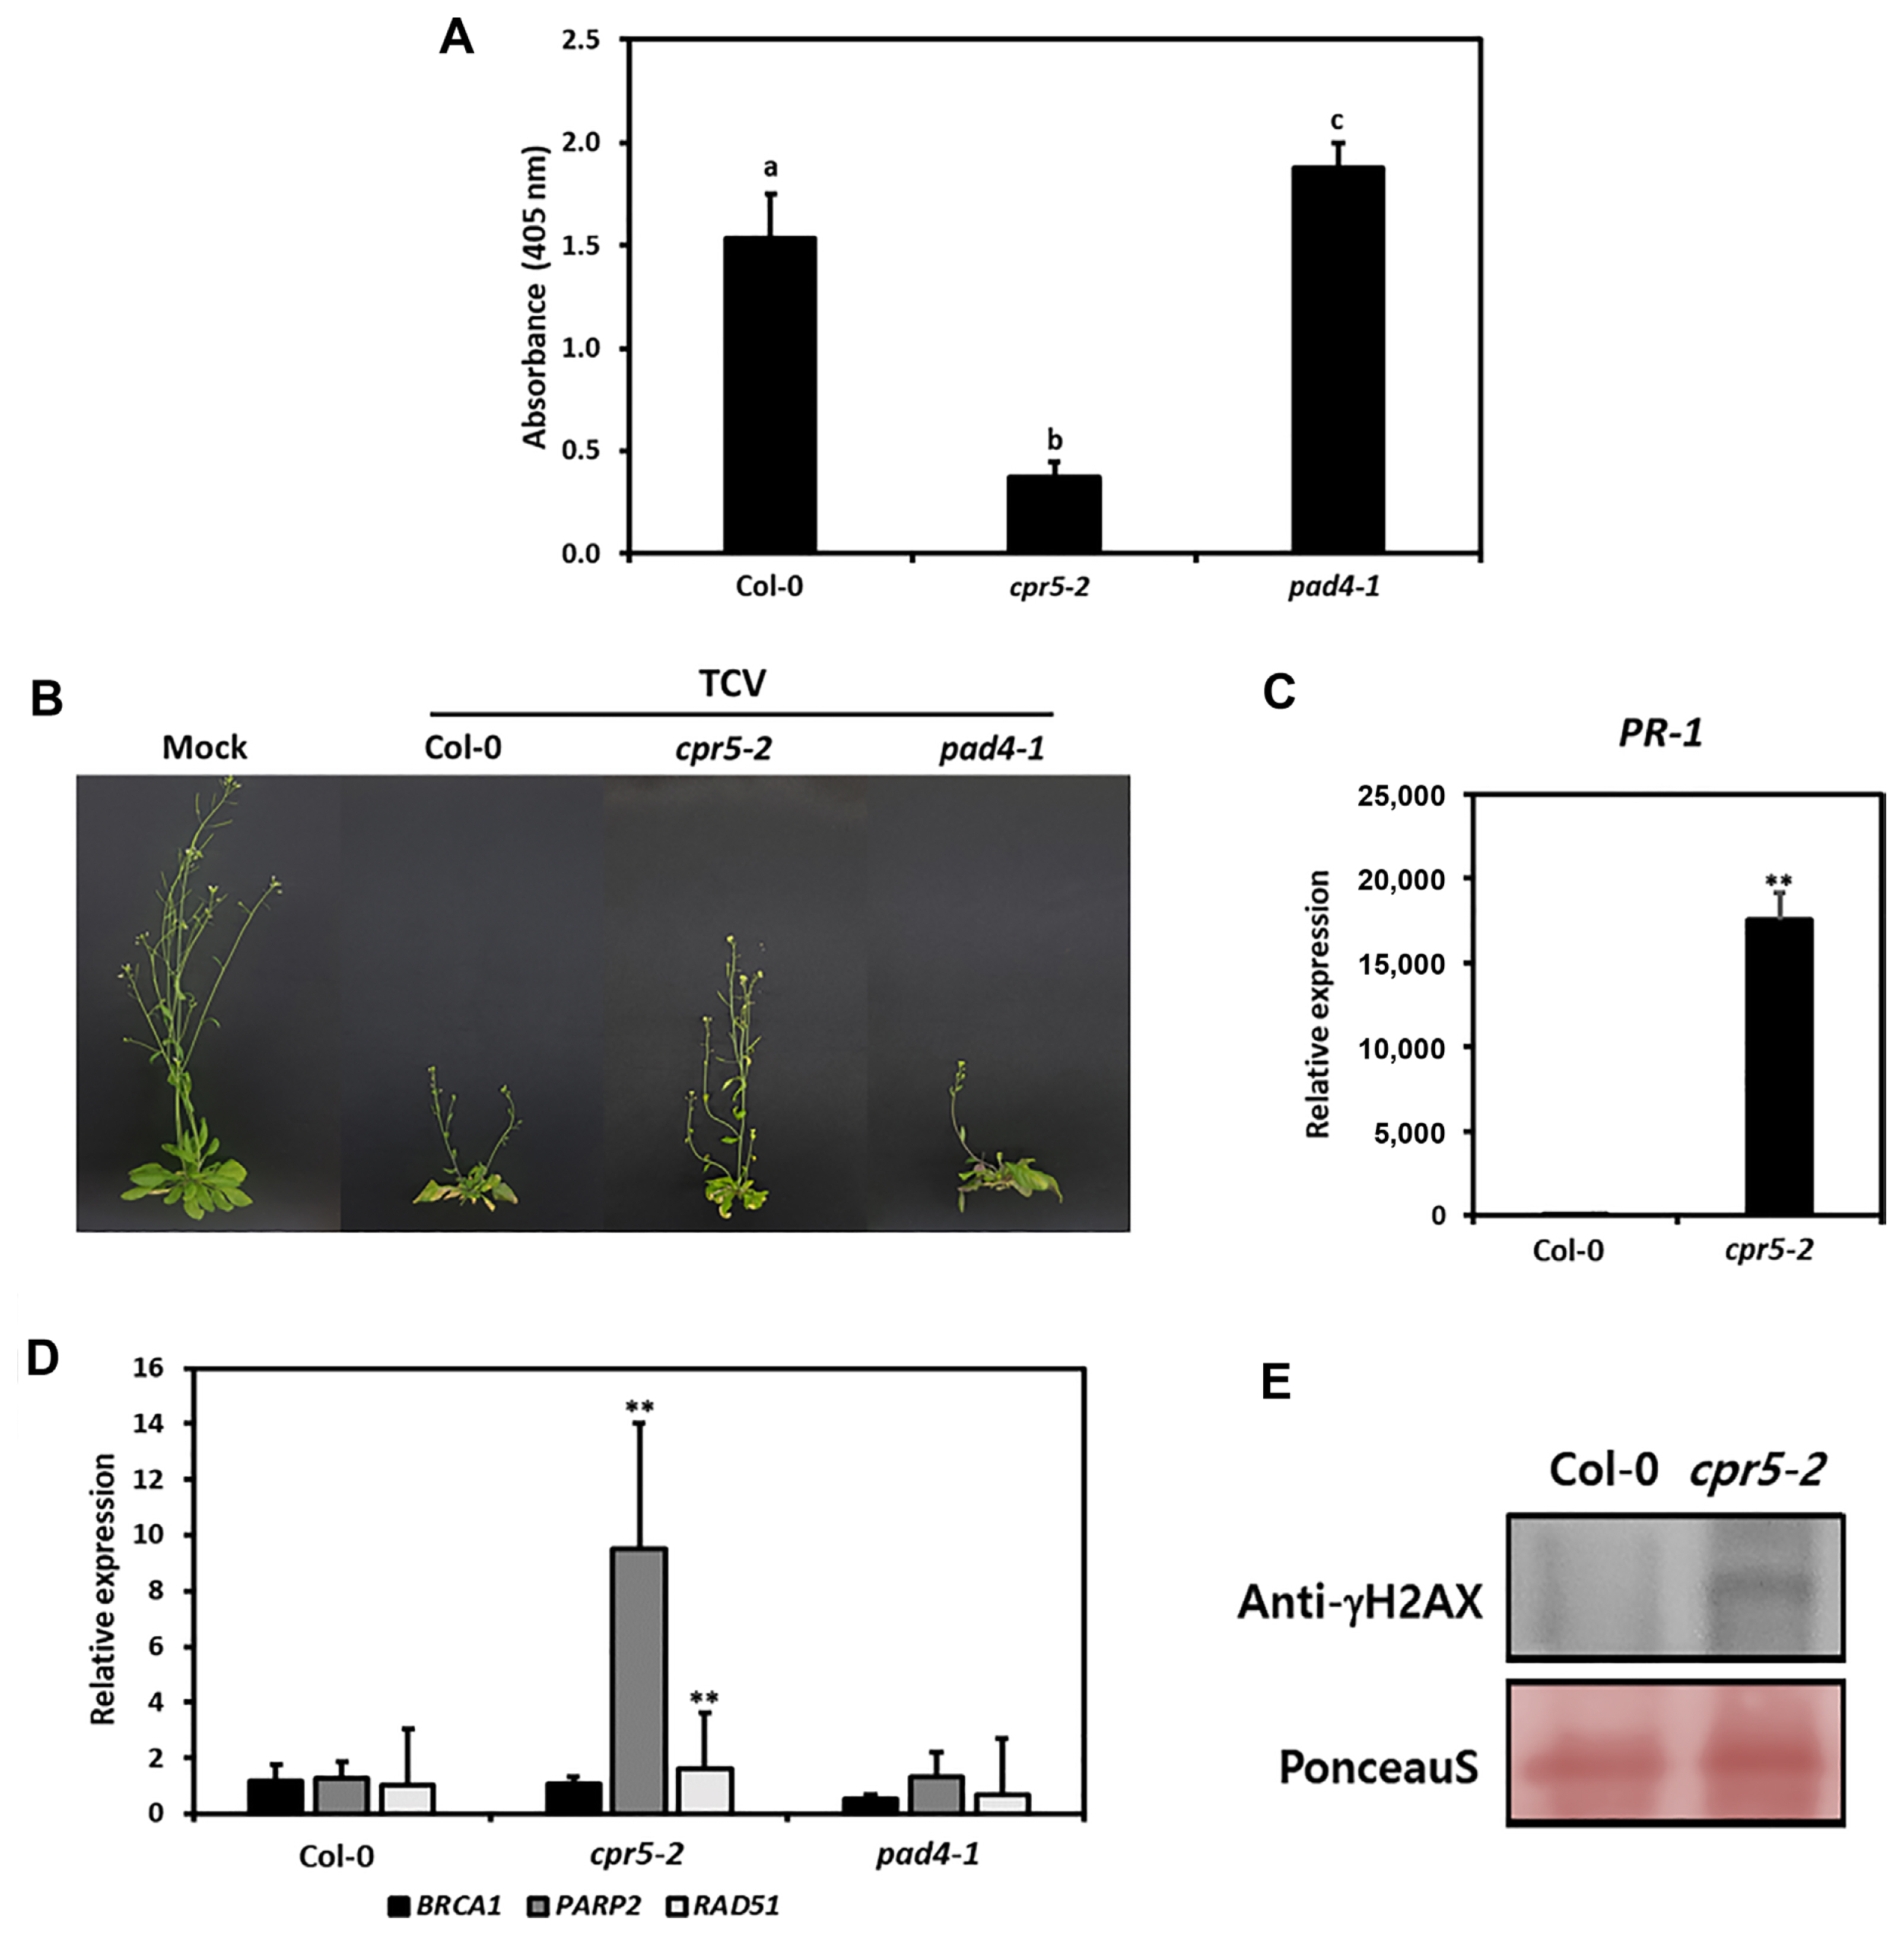
cpr5 confers resistance to turnip crinkle virus (TCV) via increasing salicylic acid accumulation. (A) The Col-0, cpr5-2, and pad4-1 plants were inoculated with TCV. Enzyme linked immunosorbent assay was performed to quantify the TCV-CP levels. The experiment was performed with three independent replicates showing similar results. The error bars indicate standard deviation (SD). (B) Typical morphological phenotypes of mock and TCV-inoculated plants. Plants were photographed at 14 days post inoculation (dpi). (C) The level of PR-1 gene expression was analyzed by quantitative reverse transcription polymerase chain reaction. (D) The expression levels of DNA damage response marker genes were analyzed in Col-0, cpr5-2, and pad4-1 by RT-qPCR. Values are presented as mean ± SD from three independent measurements. Asterisks indicate significant differences (**P < 0.01; Student’s t-test) compared to the WT. (E) DNA damage was detected in crp5-2 plants by western blot using anti-γ-H2AX antibodies. Ponceau S staining of the Western blot was used as the loading control. The experiment was repeated three times, reproducing similar results.
ATM and ATR are required for basal resistance to TCV
ATM and ATR play roles as DNA damage sensors, where ATM responds to DSB signals, and ATR responds to single-stranded DNA and replication fork breakdown signals. These signals activate both proteins and induce downstream components (Nisa et al., 2019). To examine the role of ATM and ATR in plant defense responses, the Arabidopsis atm-2, atr-2, and atm-2atr-2 double mutants were inoculated with TCV. The accumulation of TCV was examined by ELISA using an anti-TCV-CP antibody at 3 dpi (Fig. 10A). The atm-2atr-2 double mutants exhibited enhanced susceptibility compared to the WT, atm-2, and atr-2 mutant plants, whereas the atm-2 and atr-2 single mutants showed similar levels of TCV-CP accumulations (Fig. 10A). As expected, TCV-CP was highly accumulated in pad4-1, the SA pathway-defective mutant plant. The evaluation of morphological phenotypes, including plant height, showed that TCV caused stunting and drooping symptoms in all plants at 14 dpi; however, atm-2atr-2 double mutants showed more severe symptoms similar to pad4-1 mutants (Fig. 10B and C). These results indicate that ATM and ATR play overlapping roles in basal defenses against TCV infection.
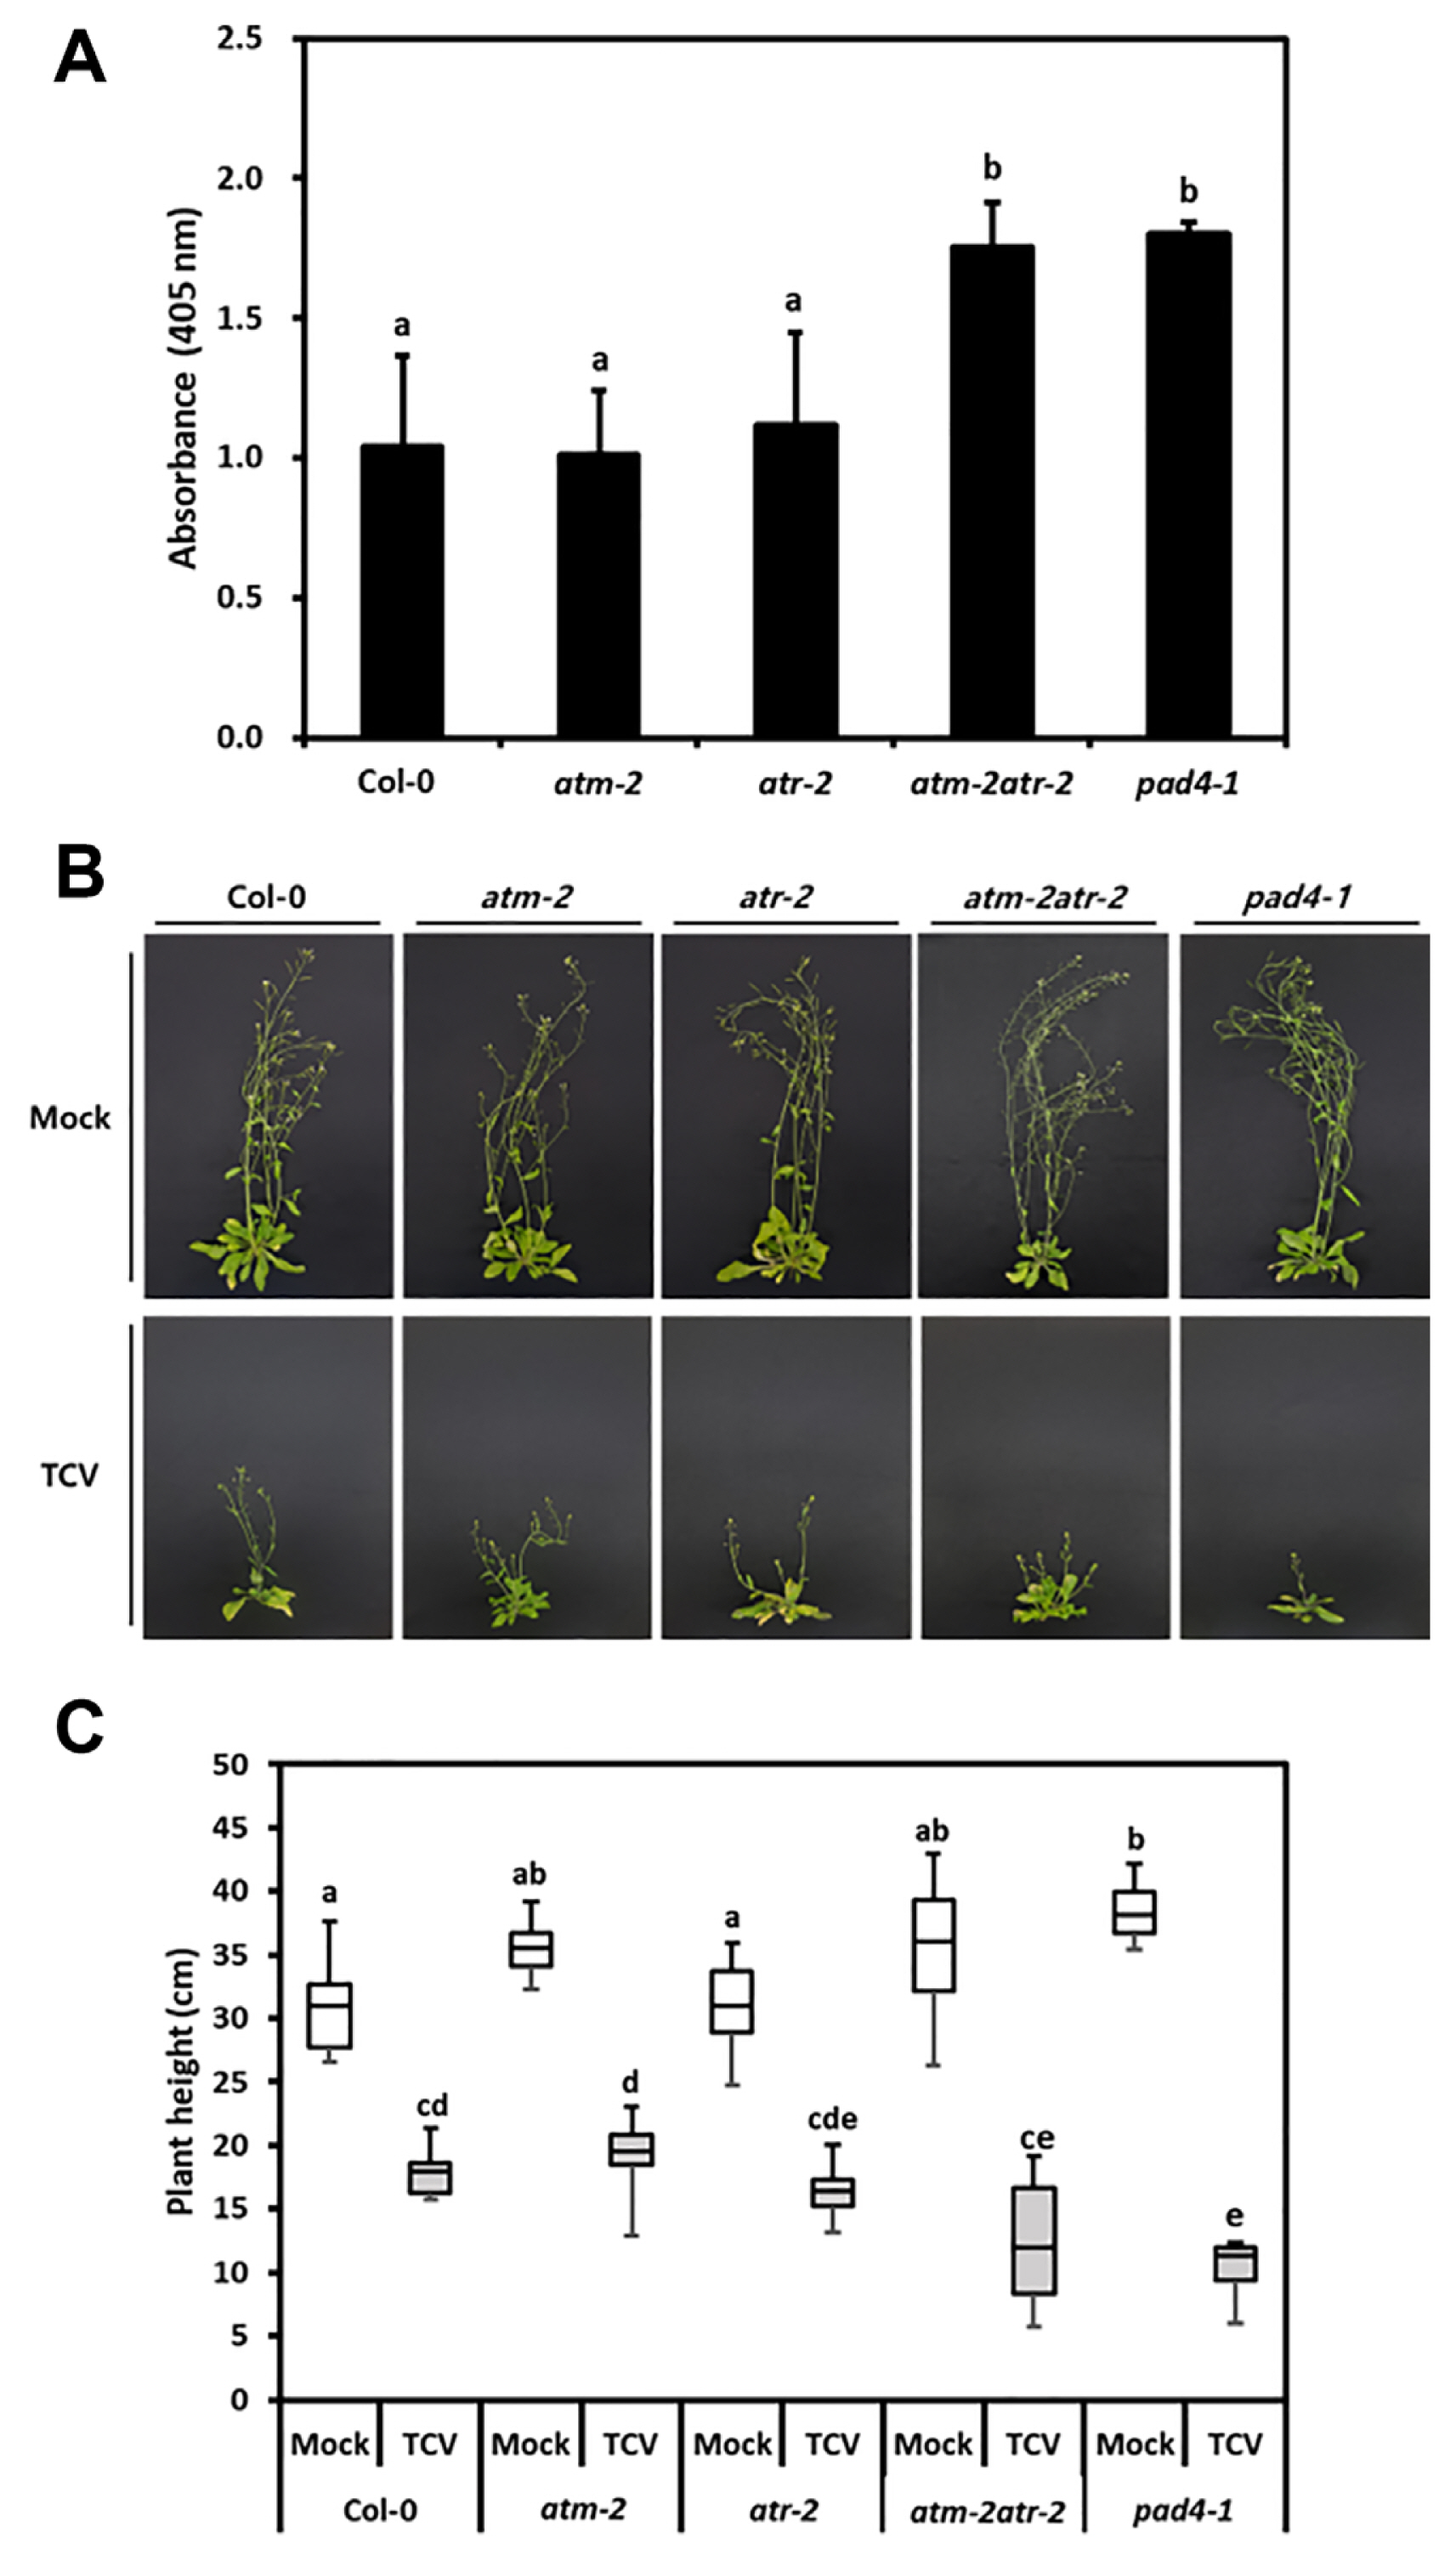
Turnip crinkle virus (TCV) accumulation and disease symptoms in DNA damage response-related mutants. (A) TCV replication levels were analyzed by enzyme linked immunosorbent assay using anti-TCV-CP antibody in local leaves at 3 days post inoculation (dpi). Values are presented as mean ± standard deviation from three independent measurements. (B) Symptoms in TCV-inoculated Col-0, atm-2, atr-2, and atm-2atr-2 mutants at 14 dpi. (C) Plant height was analyzed in mock and TCV-inoculated plants at 14 dpi. According to statistical analysis, values followed by the same letter are not significantly different (P < 0.05).
Discussion
Sessile organisms such as plants are constantly coping with exposure to endogenous metabolic byproducts, stalled replication forks, and exogenous factors, including UV-B, IR, rehydration, chemical mutagens, and temperatures that can trigger DNA damage. Consequently, plants have evolved sophisticated DNA damage detection and repair mechanisms to maintain genomic stability and produce correct genetic information. Plants cells trigger complex cellular networks, termed the DDR, which activates the DNA repair system and cell cycle arrest, thereby protecting cells from DNA damage.
This study examined DNA damage-mediated resistance to plant pathogens in Arabidopsis and N. benthamiana. DNA damage induced by BLM treatment (12.5 μg/ml) triggered plant immune response to viral pathogens (Fig. 1). The exogenous BLM application induced local and systemic TCV resistance as well as decreased TCV accumulation in the upper untreated leaves (Fig. 2). In addition, pretreatment increased the immune response to CMV, TMV, and PepMoV in local leaves (Figs. 3 and 4). We showed that DNA damage-induced immune response to viral pathogens highly correlates with SA accumulation. SA is one of the major plant hormones involved in biotic and abiotic stress responses. Despite the various functions of SA in plants, many studies have focused on its role in plant immune responses to pathogens. It is known that DNA damage by exogenous UV light exposure to tobacco increases SA levels, which subsequently activates defense mechanisms against plant pathogens (Yalpani et al., 1994). DNA damage regulates a few defense-related genes. For example, exogenous BLM application induces the relative expression levels of the PR-1, PR-2, and PR-5. Furthermore, SA-activated MAPK and WRKY genes were also induced (Fig. 6). Furthermore, DNA damage activated SA contents as well as the SA signaling pathway, suggesting that the expression of PR-1 was higher in Col-0 compared to NahG and sid2 (Fig. 8). Therefore, the increased SA levels induced by BLM treatment can be one of the defense pathways involved in BLM-mediated resistance to viral pathogens. Several opinions have emerged about SA accumulation and DNA damage during the activation of plant immune responses to pathogens. The expression of PR genes is an indicator of defense response in plants. PR-1 induction requires the transcriptional coactivator NPR1 (nonexpresser of PR genes 1) and repressor SNI1. Recessive mutation of SNI1 was found to encode a sub-unit of the SMC5/6 complex that has an important role in DNA repair (Durrant et al., 2007; Nisa et al., 2019). In the sni1 mutant, DNA damage is activated, leading to enhanced resistance to bacterial pathogens (Nisa et al., 2019). RAD51D, a suppressor of sni1, is required for NPR1-independent PR gene expression. The rad51d mutant has enhanced susceptibility to bacterial pathogens (Durrant et al., 2007). The BRCA2A, downstream of NPR1, is a key regulator of defense-related gene transcription. The BRCA2A-RAD51 complex recruits DNA damage repair proteins to the damage site and directly regulates plant immunity by binding to the PR gene promoter (Durrant et al., 2007; Wang et al., 2010). The brca2a and rad51 mutants were susceptible to Psm ES4326 (Wang et al., 2010). ATR and RAD17 are upstream regulators of HR pathways as DNA repair molecules, which upregulated DDRs in the sni1 mutant. These upstream regulators control the recruitment of homologous recombination-related proteins to defense gene transcription (Yan et al., 2013). SA induction by pathogen infections or exogenous applications of DNA damage agents is NPR1-independent and represents a new SA signaling pathway. Moreover, the synergistic effects of DDR signaling by genotoxic agents and SA signaling on the defense gene expression lead to increased immune responses to biotic stress. Exogenous SA or SAR increases HR during DNA repair (Yan et al., 2013). The sni1 mutant showed enhanced PR-1 gene expression and SA levels in basal states. It also exhibited increased HR rates; thus, SNI is a key component of the crosstalk between plant immune responses and DDR (Durrant et al., 2007; Yan et al., 2013). The cpr5-2 mutant, which confers resistance to TCV, also showed constitutive accumulation of PR-1 (Fig. 9). In addition, cpr5-2 accumulates DNA repair-related genes and γ-H2AX (Fig. 9), indicating a strong correlation between SA signaling and immune responses.
Recent evidence revealed the interaction between DDR activation and plant immunity, although the mechanisms are unclear. Key components of DDR also participated in defense responses to pathogens. SOG1 is an important transcription factor and key regulator of the DDR pathway. In addition, SOG1 target multiple defense-related genes, such as SENESCENCE-ASSOCIATED GENE 101 (SAG101), OXIDATIVE SIGNAL-INDUCIBLE1 (OXI1), AtMYB44, WRKY50, and FMO1 that respond to pathogen infections (Ogita et al., 2018). The sog101 mutant was more susceptible to hemibiotrophic fungal pathogen Colletotrichum higginsianum (Ch) compared to the WT plants, while SOG1 overexpression enhanced resistance to Ch (Ogita et al., 2018; Yoshiyama et al., 2020). SOG1 is phosphorylated by ATM and ATR, which recognize DDR signals involving pathogen infection (Ogita et al., 2018). Given that ATM and ATR play important roles as primary signal transducers of DDR, the susceptibility of atm-2atr-2 double mutants to TCV infection suggests an interesting mechanistic link between defense response and DDRs (Fig. 10). These results are consistent with previous reports that double mutations of ATM and ATR showed enhanced growth of Pst DC3000 bacterial pathogen in Arabidopsis (Song and Bent, 2014). It was previously found that ATM/ATR phosphorylates MAC3A and MAC3B (Roitinger et al., 2015). MAC3A and MAC3B are members of the MOS4-associated complex (MAC). MAC has a role in plant disease resistance, DNA repair, and cell cycle progression (Monaghan et al., 2009). The mac3a_mac3b double mutants showed susceptibility to bacterial pathogens like Pst DC3000, PsmES4326, avrRps4, and avrPphB, suggesting that MAC3A and MAC3B are related to basal and R protein-mediated defense pathways (Monaghan et al., 2009). However, the atm-2_atr-2 double mutants were more susceptible to bacterial pathogens compared to the single mutants, whereas sog101 plants were more susceptible to fungal pathogen compared to the atm-2 and atr-2 single mutant plants (Ogita et al., 2018; Song et al., 2015). These results implied that DDR defense responses to bacterial pathogens are mainly ATM/ATR-dependent (Ogita et al., 2018); whereas, DDR defense responses to fungal pathogens are SOG1-dependent.
The DDR responses to pathogens were activated by various factors depending on the pathogen’s lifestyle (Camborde et al., 2019). PARPs are key DNA damage sensors for chromatin modifications and cell death (Gibson and Kraus, 2012; Song et al., 2015). The PARPs accumulate in response to genotoxic stress for DNA repair at the damage sites (Gibson and Kraus, 2012; Song et al., 2015). PARP1 and PARP2 are required for effective DNA damage repair, of which, PAPR2 plays a stronger role (Song et al., 2015). Although the parp1-2 mutant did not differ in bacterial pathogen infection compared to the WT, the parp2-1 mutant and parp1-2parp2-1 double mutant were susceptible to bacterial pathogens. These results indicate that PARP2 works as a primary defense regulator against bacterial pathogens, and PARP1 and PARP2 have overlapping roles in response to pathogen infections. Taken together, poly(ADP-ribosyl)ation was found to be another regulator of biotic stress responses in plants.
In summary, many recent studies have focused on improving our understanding of the effects of DNA-damaging agents on plant-microbe interactions. In the current study, we found that DNA damage triggers immune responses to viral pathogens by accumulating SA and activating its associated signaling pathways. In addition, ATM and ATR were found to play central roles in immune responses to TCV in Arabidopsis. Further studies are required to identify the components of the DDR signaling pathway involved in plant immune responses. In addition, In-depth investigations are imperative to explore the molecular mechanisms underlying SOG1-mediated regulation of various cellular immune responses to pathogens.
Notes
Conflicts of Interest
No potential conflict of interest relevant to this article was reported.
Acknowledgments
We thank Prof. Jin-Sung Hong (Kangwon National University) for TMV- and CMV-infected leaf samples, Dr. Choong-Min Ryu (Korea Research Institute of Bioscience and Biotechnology) for BTH, and Prof. Pradeep Kachroo (University of Kentucky) for SA-related arabidopsis mutant seeds. This research was financially supported by the National Research Foundation of Korea (NRF) grant funded by the Korea government (MSIP) (No. 2017R1C1001873).
Electronic Supplementary Material
Supplementary materials are available at The Plant Pathology Journal website (http://www.ppjonline.org/).