Improvement of Fire Blight Blossom Infection Control Using Maryblyt in Korean Apple Orchards
Article information

Abstract
After transitioning from periodic to model-based control policy for fire blight blossom infection, it is crucial to provide the timing of field application with easy and accurate information. To assess the risk of blossom infection, Maryblyt was employed in 31 sites across apple-producing regions nationwide, including areas prone to fire blight outbreaks, from 2021 to 2023. In 2021 and 2023, two and seven sites experienced Blossom Infection Risk-Infection warning occurrences among 31 sites, respectively. However, in 2022, most of the sites observed Blossom Infection Risk-Infection from April 25 to 28, highlighting the need for blossom infection control. For the comparison between the two model-based control approaches, we established treatment 1, which involved control measures according to the Blossom Infection Risk-Infection warning and treatment 2, aimed at maintaining the Epiphytic Infection Potential below 100. The analysis of control values between these treatments revealed that treatment 2 was more effective in reducing Blossom Infection Risk-Infection and the number of days with Epiphytic Infection Potential above 100, with respective averages of 95.6% and 93.0% over the three years. Since 2022, the implementation of the K-Maryblyt system and the deployment of Automated Weather Stations capable of measuring orchard weather conditions, with an average of 10 stations per major apple fire blight county nationwide, have taken place. These advancements will enable the provision of more accurate and timely information for farmers based on fire blight models in the future.
Since the first recorded cases of fire blight on apple trees in Korea at Anseong and Jecheon in 2015 (Kim and Yun, 2018; Myung et al., 2016; Park et al., 2016), the incidence of the disease peaked in 2020 at Chungju, Jecheon, and Eumseong (Ahn and Yun, 2021). In 2021, the disease did not have a high impact on the existing cities or counties, but it spread to neighboring counties such as Goesan and Danyang, which are close to Chungju (Ahn and Yun, 2021). Fortunately, the disease has not been recorded until 2023 in major production counties in Gyeongbuk such as Cheongsong, Uiseong, Mungyeong in Korea.
The causal pathogen of fire blight, Erwinia amylovora, is able to infect apple trees through various routes including flowers, newly emerged shoots, and wounds (Biggs et al., 2008). To effectively control this disease, it is essential to block all possible infection routes as well as to eliminate over-wintering cankers throughout the entire lifespan of apple trees (Steiner, 2000). To determine the appropriate timing for disease control, it is important to accurately predict the infection. This requires a disease model that takes into account all possible infection routes and provides timely warnings based on the disease cycle (Giayetto and Rossini, 2011).
Several fire blight models have been developed and are widely used, including MTL (Thomson et al., 1982), Maryblyt (Steiner, 1990), Cougarblight (Smith, 1993), and BIS98 (Billing, 1996, 1999). These models forecast fire blight infection based on temperatures and precipitations for the host lifetime, but they can only be applied in environments where the models were developed (Bonn and Leuty, 1993; Gouk et al., 1996; Van der Zwet and Lightner, 1993). Therefore, it is necessary to choose the appropriate model for the local environment. The Maryblyt model (Maryblyt) was developed in Maryland, USA, where the climate similar to Korea’s (Kim and Yun, 2018). It considers various environmental variables that affect the opening period of apple blossoms and can predict blossom infection risk (BIR) during the open blossoming period. During flowering, Maryblyt calculates the Epiphytic Infection Potential (EIP, the unit is degree hour, DH), which is the pathogenic density on style of apple blossom, and changes based on temperature and humidity (Steiner, 1990). The BIR is based on four conditions, collectively known as BHWT: blossomed (B), EIP is over 100 (H), more than 2.5 mm precipitation (W), and a daily average temperature higher than 15.6°C (T) (Ahn and Yun, 2021; Lightner and Steiner, 1993). The level of BIR is determined by the number of BHWT conditions met, with 1 indicating 'Low' risk (BIR-L), 2 indicating 'Moderate' risk (BIR-M), 3 indicating 'High' risk (BIR-H), and 4 indicating 'Infection' risk (BIR-I).
Until 2021, the Rural Development Administration (RDA) in Korea recommended controlling fire blight on blossom by spraying fungicides 5 days after full bloom, followed by a second spray 10 days after the first spray (Ham et al., 2020). However, starting from 2022, the fire blight control strategy has been revised to align with disease model warnings. Previously, it was uncommon to observe BIR-I on pears in Korea, thus the model recommended spraying at BIR-H. In contrast, BIR-I occurrences have become more frequent in apples, leading to the model’s recommendation of spray at BIR-I. However, BIR-I did not occur in apple orchards in 2018, highlighting the need to revise the apple control strategy. To discover more proactive and effective control methods using the model, our objective is to maintain the EIP level on the style in apple blossom below 100, which shift the blossom blight condition from H+ (EIP over 100%) to H− (EIP reset to 0). It is necessary to compare the effectiveness of spraying only at BIR-I, as recommended by the model, with the approach of maintaining EIP below 100.
Maryblyt has the ability to change the EIP level or reset it to EIP = 0 when a chemical spray is applied. After the spray, the infection event is usually downgraded to a high risk (http://grapepathology.org/maryblyt). Streptomycin is an effective pesticide for reducing the population level of the pathogen on the style (Johnson and Stockwell, 1998). However, its use is highly restricted in Korea due to streptomycin’s antibiotic resistance (Kim et al., 2023), and it is even banned in Europe (Gusberti et al., 2015). Other pesticides, such as oxolinic acid, oxytetracycline cannot decrease the pathogen’s population, but they can prevent its increase. By spraying chemicals when Maryblyt warns of an infection, the EIP level can be controlled, and the strategy can maintain the EIP level below 100. Therefore we are trying to find the right time to control EIP level below 100 during the opening of flowers to control blossom infection.
This study aims to predict the occurrence of blossom infection in major apple production areas where fire blight has occurred or is yet to occur in the 2021–2023 season. Additionally, we aim to propose a viable control strategy for maintaining the EIP below 100 using Maryblyt’s spray mode. The objective of our study is to develop a highly effective strategy for controlling fire blight blossom infection in Korean apple production.
Materials and Methods
Collection of weather data
Data from 2021–2023, Table 1 shows a list of 31 weather station sites used for Maryblyt operation to predict blossom blight infection. These sites include 24 sites where fire blight has occurred in apple orchards, as well as seven sites with major apple production areas in Gyeongbuk where occurrences have never been reported. These sites were located in 23 cities or counties throughout Korea.
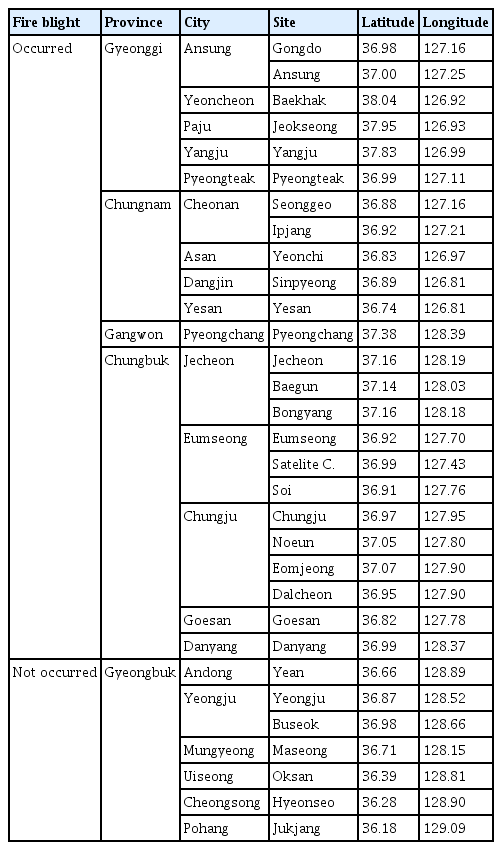
List of 31 weather station sites used for Maryblyt operation of blossom blight, including 24 sites with reported fire blight occurrence on apple orchards and seven sites with no reported occurrence but are major apple production areas in Korea
Meteorological records were collected from the OpenAPI of the automatic synoptic observing system and automatic weather observation system available on the open MET data portal (https://data.kma.go.kr/cmmn/main.do), as well as from the automatic agricultural weather system of the Rural Development Administration Agricultural Weather 365 (http://weather.rda.go.kr). The meteorological data used to calculate the phenological model included daily high and low temperatures from October 1 of the previous year to May 31 of the current year. For running the Maryblyt model, the highest and lowest daily temperatures and daily cumulative precipitation data from March 1 to June 30 of the current year were utilized.
A viable control strategy for maintaining the EIP below 100 using Maryblyt’s spray mode
In the spray mode of the Maryblyt system, the input “yes” on a specific day triggers the model to reset EIP to 0, causing the H condition to change from + (EIP over 100%) to − (EIP reset to 0). This approach ensures that spraying is done at right time to maintain EIP below 100, leading to a viable control strategy. However, it is essential to consider that the W condition changes from - (no precipitation) to + (humid due to spray).
Due to the RDA’s recommendation to alternate several pesticides for fire blight control, including streptomycin, oxolinic acid, and oxytetracycline, we modified Maryblyt’s EIP calculation algorithm to account for the different abilities of these pesticides to decrease or not increase the pathogenic populations (Fig. 1, gray background) in addition to the original algorithm (Fig. 1, clear background). We assumed that streptomycin reduces 80% of the existing the pathogenic population, while oxolinic acid and oxytetracycline do not increase the population. We also assumed that the duration of effect for each chemical is three days.

Flowchart depicting the calculation of epiphytic inoculum potential (EIP) levels, representing the amount of the pathogen, Erwinia amylovora, present on apple blossom styles. DD, degree day; DH, degree hour.
We evaluated the efficacy of the two treatments for controlling blossom blight and a control. Control refers to no spray treatment. Treatment 1 involved spraying streptomycin as soon as Maryblyt issues a BIR-I warning and a second spray of streptomycin on the day before rain is forecasted. Treatment 2 involved spraying oxolinic acid on the day before Maryblyt warns either BIR-I or BIR-H, followed by a second spray of streptomycin three days after the first spray and a third spray of oxytetracycline when the infection alert (BIR-I or BIR-H) is given. The effects of these three treatments were compared to control values from 2021 to 2023 at 31 sites. Control values of the two treatments were calculated by the following equation:
Results
Evaluation risks of apple blossom infection in 2021–2023 by Maryblyt
2021
To determine the occurrence of BIR-H (high) or BIR-I (infection) warnings in 2021, Maryblyt was run at 31 sites. BIR-I (red color) alerts were observed at Ipjang-myeon and Yeomchi-eup in Chungnam-do (Fig. 2). The dates of infection warning were April 21 and April 28. Overall, the risk of apple blossom infection in 2021 was not severe. The dates of petal fall ranged from April 27 to May 4 in Gyeonggi-do, April 23 to May 3 in Chungnam-do, April 30 to May 6 in Kangwon and Chungbuk-do, and April 23 to May 17 in Gyeongbuk and Gyeongnam-do.

Blossom blight risk assessment in 2021 on fire blight-occurred sites and the major apple production sites. The red date represents the infection risk (BIR-I), the orange date represents the high risk (BIR-H), the green date represents the moderate risk (BIR-M) and the low risk (BIR-L) of fire blight infection on apple trees. BIR, blossom infection risk; GT, green tip; CBS, canker blight symptom.
BIR-H (orange color) alerts mainly ranged from April 21 to April 24 in Gyeonggi-do and Chungbuk-do. Several sites showed BIR-H alerts on April 25, 26, and 28. In Chungnam-do, BIR-H alerts were ranged from April 21 to 26. In Gyeongbuk-do, BIR-H alerts were ranged on April 22 to 23.
Maryblyt predicted the date of canker blight symptom (CBS) in 2021 from May 15 to 24 in Gyeonggi-do, May 14 to 20 in Chungnam-do, and May 18 to 30 in Kangwon and Chungbuk-do, and May 14 to June 1 in Gyeongbuk-do. The first dates of flower opening (B1) varied in 2021, with the earliest B1 occurring on April 1 and the latest B1 on April 24. Green tip was observed from March 10 to March 31. Most sites experienced full bloom (BB) between April 18 and 24. However, three sites had BB on April 11, and one site had BB on April 12 and April 15 to 17, respectively.
2022
The BIRs by Maryblyt in 2022 revealed severe conditions at 29 of the investigated sites, as indicated by the presence of BIR-I warnings. The only exceptions were the Jeokseong and Yangju sites in Gyeonggi-do (Fig. 3). The dates of BIR-I in 2022 ranged from April 25 to April 28, with the days of BIR-I varying from one to four days depending on the sites. Additionally, the projected full bloom day were between April 25 and April 30. Approximately 50% of the sites experienced BIR-I on the day of full bloom, while the remaining sites did not have BIR-I at full bloom. However, there was only one- to three-day difference between BIR-I and BB in those sites.
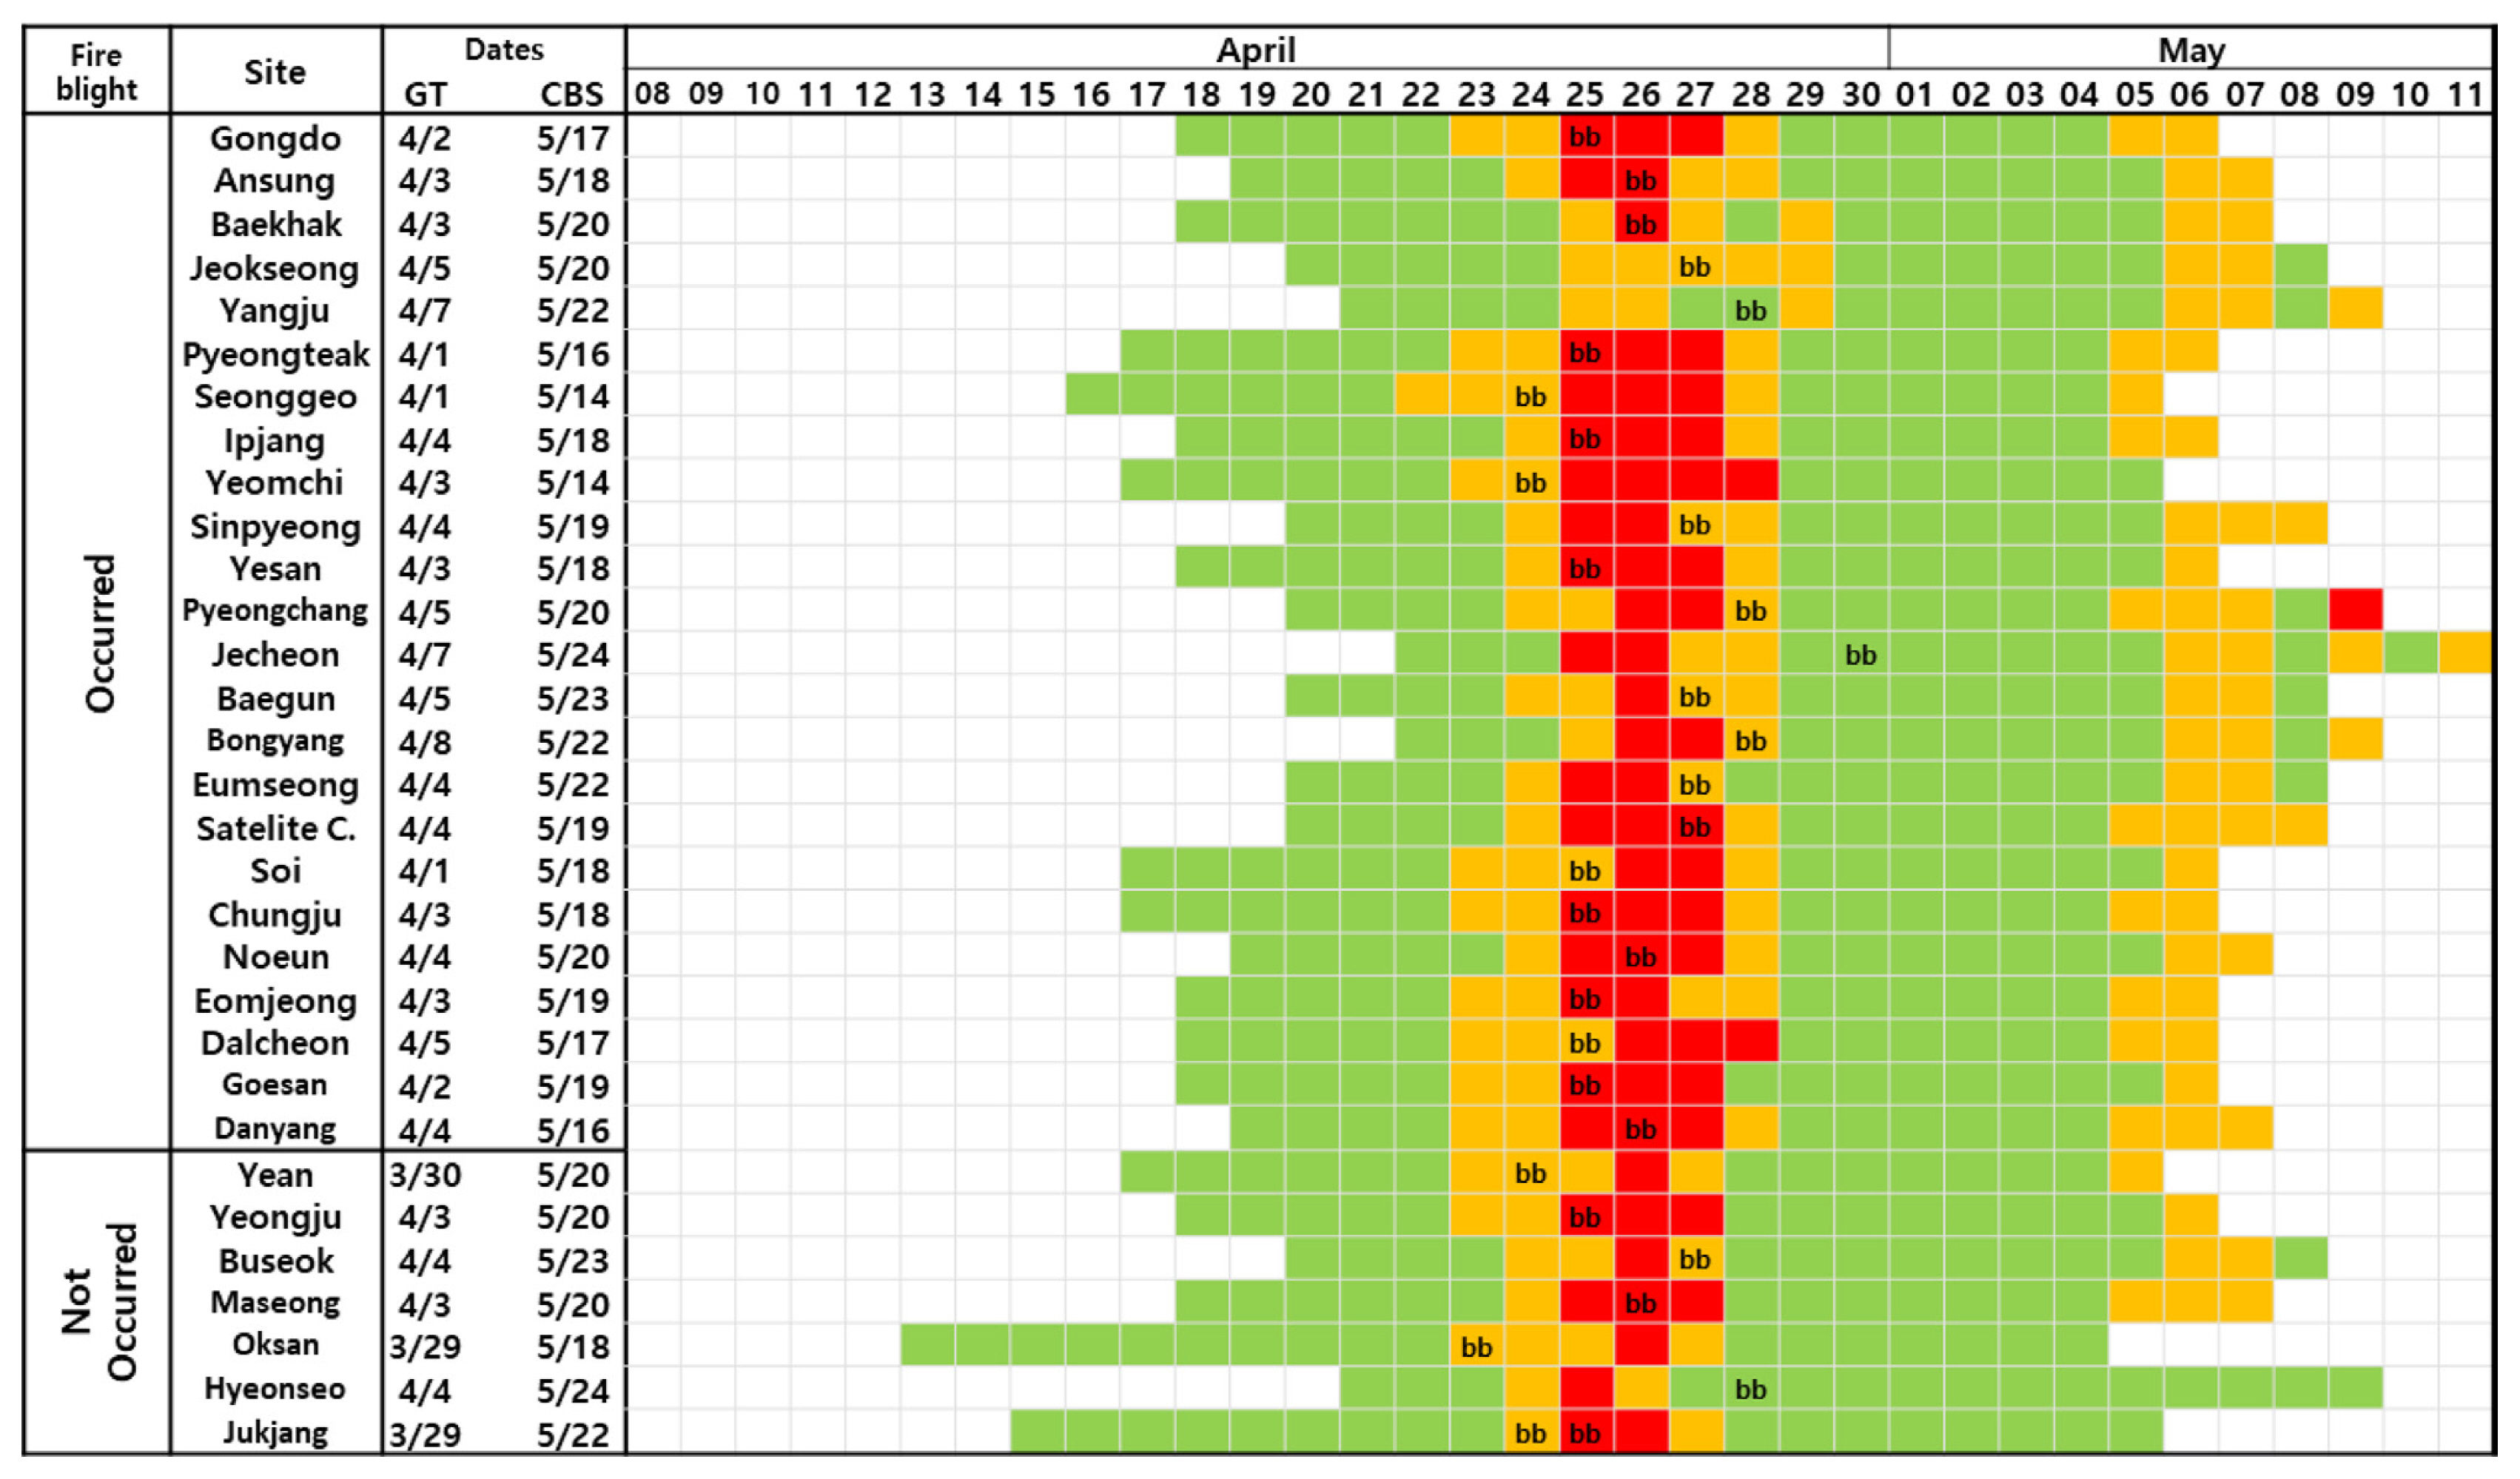
Blossom blight risk assessment in 2022 on fire blight-occurred sites and the major apple production sites. The red date represents the infection risk (BIR-I), the orange date represents the high risk (BIR-H), the green date represents the moderate risk (BIR-M) and the low risk (BIR-L) of fire blight infection on apple trees. BIR, blossom infection risk; GT, green tip; CBS, canker blight symptom.
Maryblyt also predicted the occurrence of CBS from May 11 to May 24, varying across the different sites. These days were designated for scouting canker symptoms in apple orchards and eradicating symptomatic plant parts. All the sites in Gyeongbuk, where fire blight had not yet occurred, exhibited BIR-I on the similar days as the affected sites in Chungbuk. In addition, the periods of blossom opening were similar between Gyeongbuk and Chungbuk. The dates of green tip sprouting in 2022 ranged from March 29 to April 7 at 31 sites.
2023
Among the 31 sites investigated, only seven sites displayed BIR-I warnings in 2023. BIR-I alerts were observed at Cheonan and Asan in Chungnam-do, as well as two sites in Eumsung, Chungbuk-do, during the full bloom dates (BB) from April 19 to 21. In contrast, BIR-I alerts at Paju and Yangju in Gyeonggi-do, and Dangjin in Chungnam-do, occurred towards the end of the blossom opening period, indicating a lower risk of blossom infection (Fig. 4).
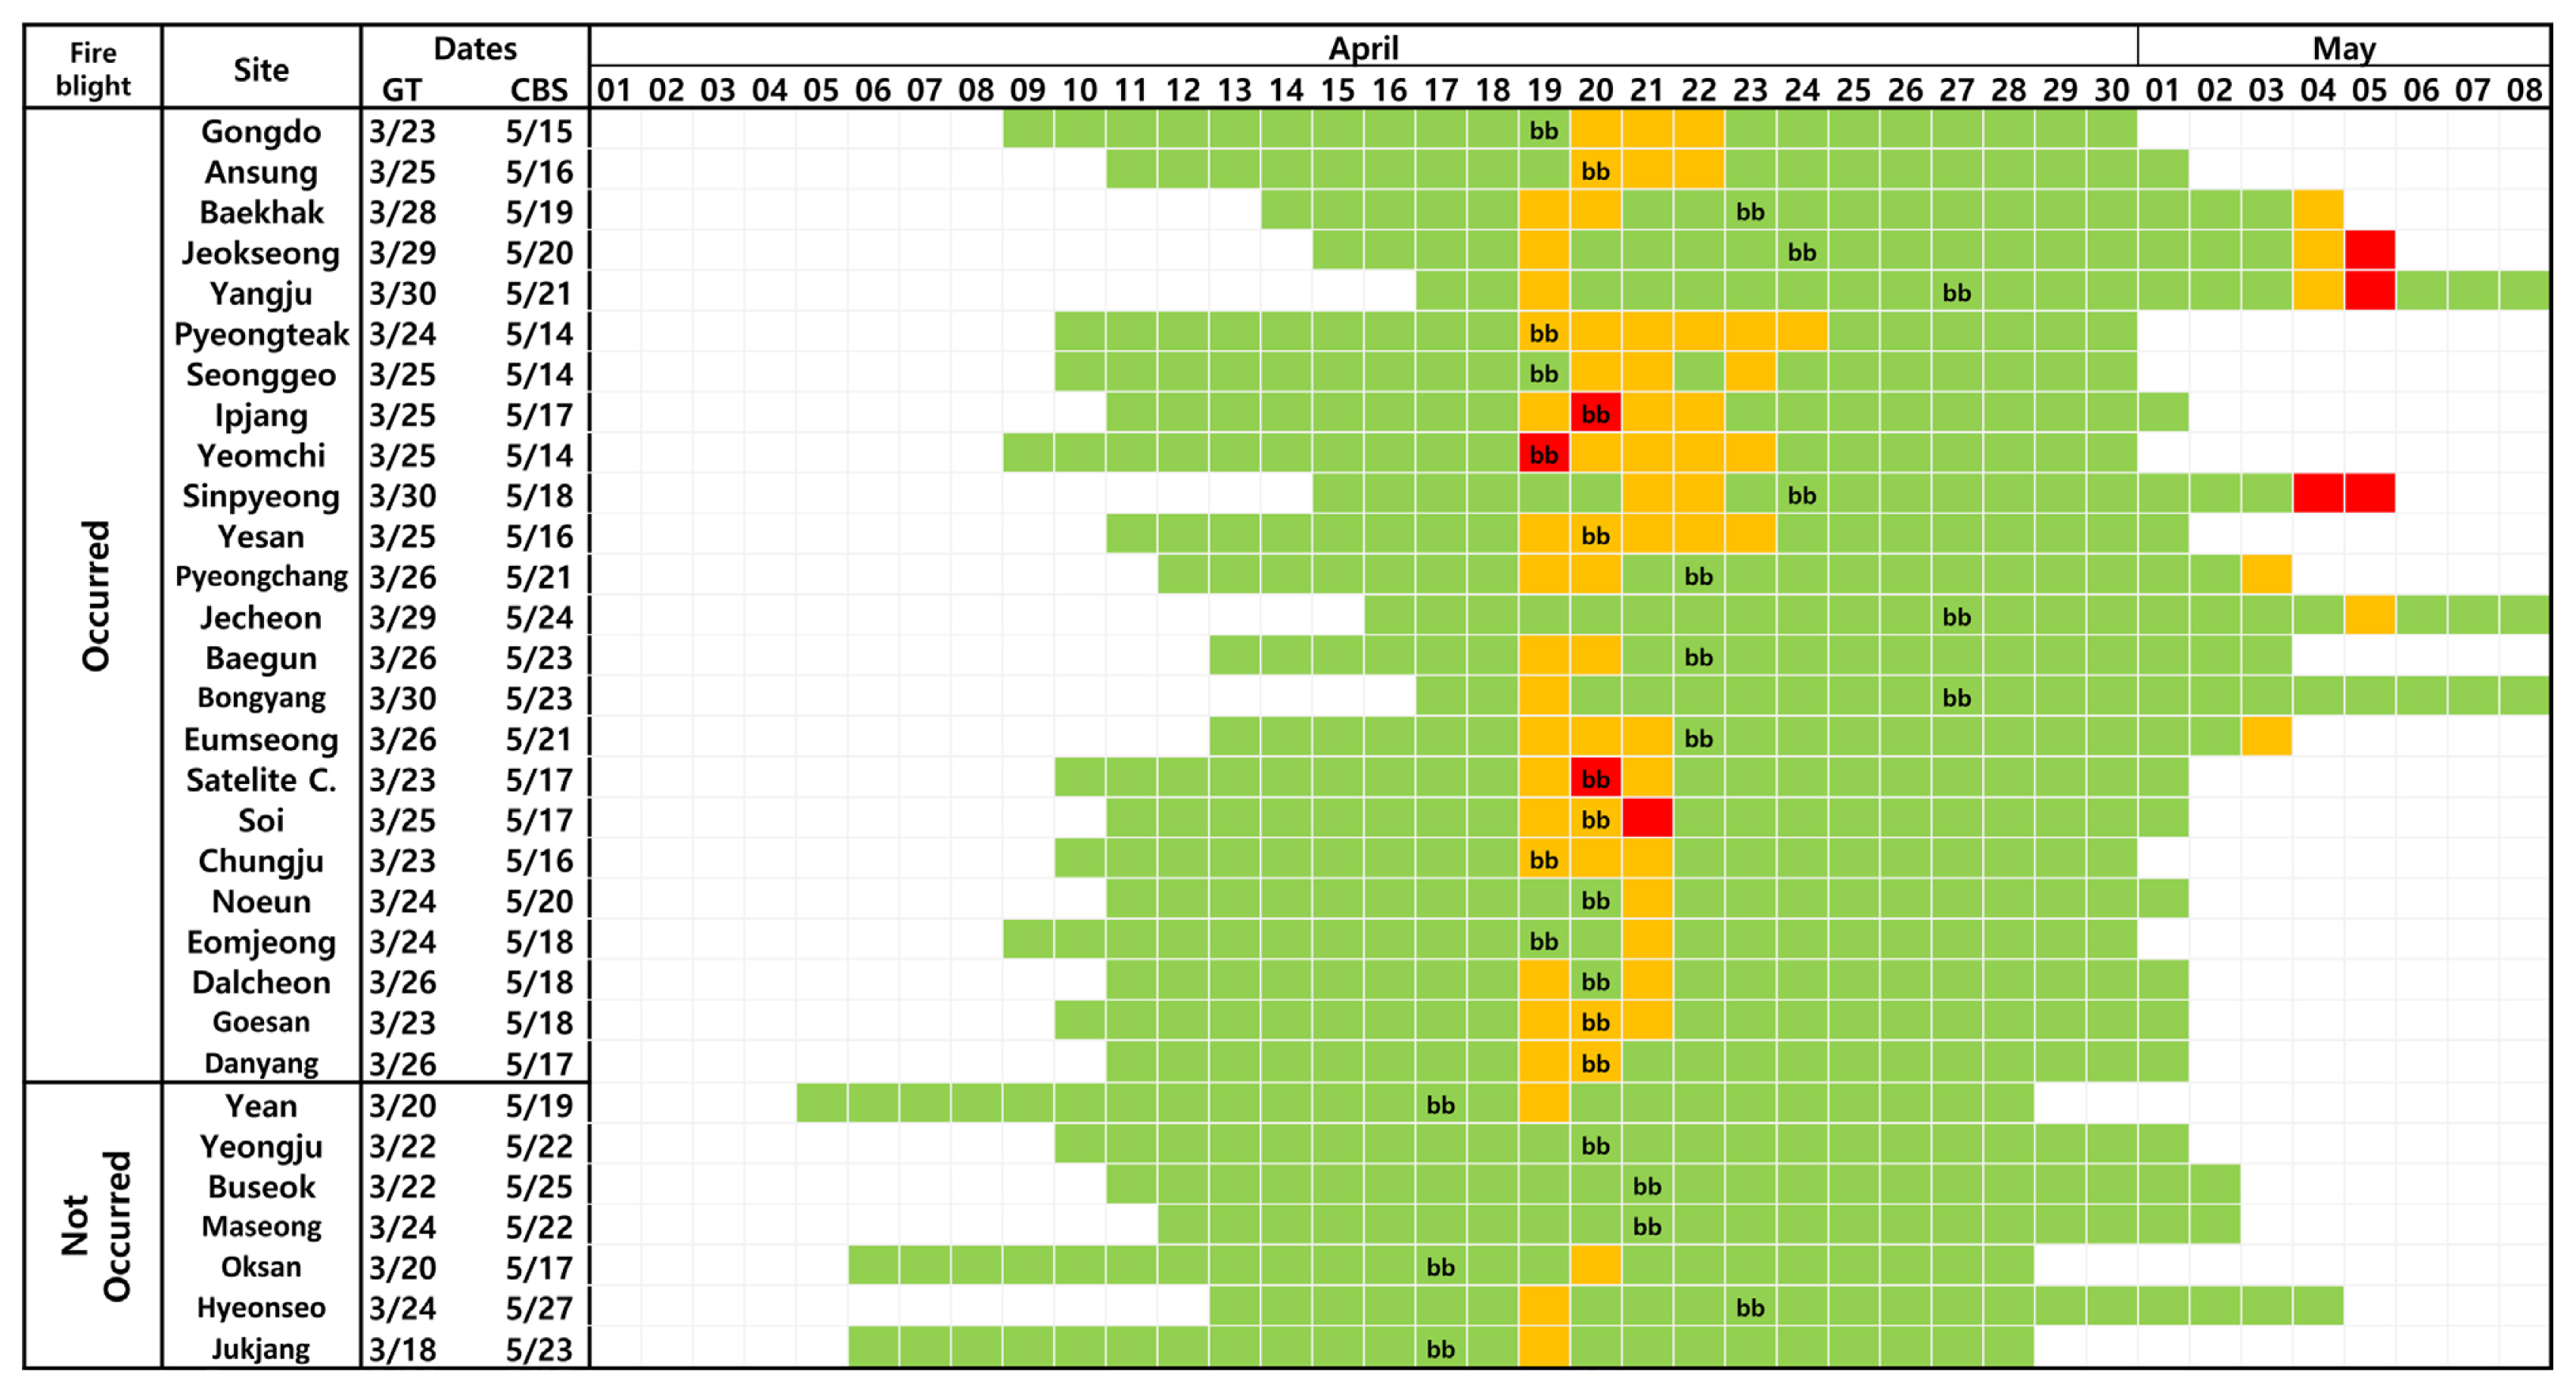
Blossom blight risk assessment in 2023 on fire blight-occurred sites and the major apple production sites. The red date represents the infection risk (BIR-I), the orange date represents the high risk (BIR-H), the green date represents the moderate risk (BIR-M) and the low risk (BIR-L) of fire blight infection on apple trees. BIR, blossom infection risk; GT, green tip; CBS, canker blight symptom.
Maryblyt also predicted the occurrence of CBS from May 14 to May 27, varying across the different sites. These days were designated for scouting canker symptoms in apple orchards and eradicating symptomatic plant parts. The periods of blossom opening were similar between Gyeongbuk and Chungbuk.
A new strategy for blossom blight control maintaining EIP below 100
Fig. 5 shows EIP levels for the three treatments over the course of the flowering season. The dotted control EIP line was dynamically fluctuated based on temperature and humidity conditions. The arrows below the dates (X-axis) indicate the timing of spray for treatment 1 and treatment 2, leading to changes in the two treatment lines. It is evident from the figures that the EIP lines of treatment 2 were consistently adjusted below 100, indicating effective control blossom infection. On the other hand, the EIP lines of treatment 1 occasionally exceeded 100, and in 2021, no spray was conducted for Backun site (Fig. 5B).

Epiphytic inoculum potentials (EIP) on Backun, Chungbuk in 2022 (A), 2021 (B) and Jecheon, Chungbuk in 2022 (C) under the three treatment regimens. The arrows indicate the timing of sprays in each treatment. Treatment 1 was to spray as soon as Maryblyt model warns BIR-I and a second spray when the day before the rain forecasted. Treatment 2 was to spray as soon as Maryblyt warned BIR-I or BIR-H, followed by a second spray 3 days after the first, a third spray either when the infection alert (BIR-I or BIR-H) was given. BIR-I, blossom infection risk-infection; BIR-H, blossom infection risk-high.
Table 2 presents the results from the investigation conducted across 31 sites. In 2022, the average number of sprays applied for blossom blight control was 1.77 in treatment 1 and 2.87 in treatment 2. In 2021, the average number of sprays was 0.06 in treatment 1 and 2.0 in treatment 2. In 2023, the average number of sprays increased to 0.37 in treatment and 2.11 in treatment 2. Treatment 2 consistently applied at least two or more sprays, even when the severity of blossom infection was not significant. The average number of BIR-I warning by Maryblyt (No. of infection) in 2022 was 1.97 days, while it was 0.06 days in 2021 and 0.29 days in 2023. By implementing fungicide sprays accordingly, the number of infections in 2022 reduced to 0.0 for treatment 1 and 0.16 times for treatment 2. The control values for these cases in 2022 were 99% and 87%, respectively. Additionally, the average values of accumulated EIP over 100 (accumulated EIP over 100) per site were 323.3 degree-day (DD), 407.5 DD, and 70.1 in 2021, 2022, and 2023, respectively. Through the implementation of the two treatment strategies, the accumulated EIP over 100 in 2022 were decreased to 215.5 DD for treatment 1 and 22.9 DD for treatment 2. The control values for treatment 1 and treatment 2 in 2022 were 47% and 94%, respectively. Overall, the control values for both treatments over three years clearly demonstrated the efficacy of the spray strategies. The control values for treatment 2 were consistently higher than those for treatment 1 throughout the three years.

Maryblyt output of apple blossom infection according to the treatments at the averages of 31 site in 2021 to 2023
Discussion
According to the model control strategy, it is recommended to apply chemical control for blossom blight when Maryblyt issues a BIR-I warning (Turechek and Biggs, 2015). In 2022, this required spraying between April 25 and April 28 at 29 sites, excluding Jeokseong and Yangju in Gyeonggi-do. However, no spray was necessary at most sites in 2021 and 2023. In contrast, the new model strategy, which aims to maintain the EIP below 100, required at least 2 rounds of chemical spraying at most sites in 2021 and 2023. By implementing the new model strategy, control values for accumulated EIP over 100 improved, ranging from 94% to 100%, compared to the previous ranging of 3% to 47%. Furthermore, the new model strategy successfully reduced the number of days with EIP over 100 by 2 to 6 days over the three years. These findings demonstrate that the new model strategy offers a more frequent and proactive approach to control fire blight compared to the existing model control.
During the flower opening period, the earlier stage (from B1 to BB) is of greater importance for spraying based on the model’s warning compared to the later stage (from BB to PF). As approximately 80% of the flowers in the orchards open during the earlier stage, the timing of flower opening significantly influences the risk of blossom infection. Hence, adhering to the model’s warning during the earlier stage is crucial for effective blossom infection control although farmers should be aware of the overall opening period. Clearly, the risk of blossom infection in 2022 was the highest among the three years, and the risk in 2023 was higher than in 2021. In 2023, BIR-I or BIR-H warnings were detected around the full bloom stage at most of the sites.
Following the transition from periodical to model control for blossom blight, the RDA introduced the K-Maryblyt service system (m.fireblight.org) starting in 2022 (Yang et al., 2022). Previous research comparing Maryblyt and K-Maryblyt results on pear tree highlighted the need for continuous improvements due to delayed and inaccurate BIR-I warnings in 2022 (Namkung and Yun, 2022). In our study, comparing the BIR-I alerts for apple trees in 2022, we found that out of 31 sites, 20 sites (66.7%) had matching alerts from both Maryblyt and K-Maryblyt, 10 sites (32.3%) experienced a one-day delay in K-Maryblyt alerts, and one site (3.2%) did not receive an alert from K-Maryblyt. Overall, K-Maryblyt demonstrated a 97% effectiveness in pest control measures (Namkung et al., 2022). Thus, the K-Maryblyt system has proven to be a valuable resource, providing an accessible fire blight prediction model for farmers and policymakers.
We proposed a new calculation method for the EIP to address the necessity of recalculating the application of different fungicides. According to the RDA’s field study (personal communication), streptomycin was effective in reducing the pathogen population by up to 80%, while oxytetracycline and oxolinic acid did not increase but maintained the population at the same level for three days. Our calculated EIP values were approximately 2% and 5% higher than those of Maryblyt. When comparing the average values of total EIP for all 31 sites, Maryblyt’s calculation yielded 1,665 DD, whereas our new calculation resulted in 1,702 DD in 2021. Similarly, for the average values of accumulated EIP over 100, Maryblyt’s calculation produced were 408.1 DD, while our new calculation yielded 430.9 DD in 2021. This discrepancy in EIP values could potentially be attributed to the conversion of DD or DH units from Celsius to Fahrenheit.
In Spain, fire blight prediction models including Maryblyt, have been effectively utilized to combat the disease (Palacio-Bielsa et al., 2012). These models aim to prevent infections by promptly controlling blossom blight through assessing the risk of blossom infection using predictive models. Additionally, they help eradicate diseased plant parts in orchards by scouting for canker blight symptoms using disease models. This approach has successfully led to the temporary eradication of fire blight in the Aragon region and subsequent years of manageable disease control following the initial outbreak. To prevent the spread of fire blight to adjacent counties, the K-Maryblyt system is expected to predict infection and symptom appearance. Furthermore, incorporating field data such as precise periods of blossom opening, the first date of symptom appearance in an orchard, and information on apple tree varieties and age can further enhance the accuracy of the fire blight prediction model’s results.
Notes
Conflicts of Interest
No potential conflict of interest relevant to this article was reported.
Acknowledgments
This work was supported by the Cooperative Research Program for Agriculture Science & Technology Development (Project No. RS-2020-RD009731) of the Rural Development Administration of the Republic of Korea.