Comparative Genome Analysis Reveals Natural Variations in the Genomes of Erwinia pyrifoliae, a Black Shoot Blight Pathogen in Apple and Pear
Article information

Abstract
Erwinia pyrifoliae is a Gram-negative bacterial plant pathogen that causes black shoot blight in apple and pear. Although earlier studies reported the genome comparison of Erwinia species, E. pyrifoliae strains for such analysis were isolated in 1996. In 2014, the strain E. pyrifoliae EpK1/15 was newly isolated in the apple tree showing black shoot blight in South Korea. This study aimed to better understand the similarities and differences caused by natural variations at the genomic level between newly isolated E. pyrifoliae EpK1/15 and the strain Ep1/96, which were isolated almost 20 years apart. Several comparative genomic analyses were conducted, and Clusters of Orthologous Groups of proteins (COG) database was used to classify functional annotation for each strain. E. pyrifoliae EpK1/15 had similarities with the Ep1/96 strain in stress-related genes, Tn3 transposase of insertion sequences, type III secretion systems, and small RNAs. The most remarkable difference to emerge from this comparison was that although the draft genome of E. pyrifoliae EpK1/15 was almost conserved, Epk1/15 strain had at least three sorts of structural variations in functional annotation according to COG database; chromosome inversion, translocation, and duplication. These results indicate that E. pyrifoliae species has gone natural variations within almost 20 years at the genomic level, and we can trace their similarities and differences with comparative genomic analysis.
Erwinia pyrifoliae, a Gram-negative bacterium causing black shoot blight in Asian pear (Pyrus pyrifoliae), was first observed in 1995 and reported in 1999 in South Korea (Kim et al., 1999). Since then, this disease still has been sporadically observed only in South Korea until now. The symptoms are black shoot blight in pear, showing blackish blight in twigs, necrotic foliage, and black stripes on the leaves. This disease can spread to entire stems and make necrosis of the flower and immature fruits. Since this disease was reported in pear, it also has been observed in apple trees, showing brownish blight in twigs (Han et al., 2016). These symptoms in apple and pear are very similar to those of fire blight caused by Erwinia amylovora, which is a devastating disease in many Rosaceous plants, including apple (Malus spp.) and pear (Pyrus spp.) worldwide. However, E. pyrifoliae was distinguished from E. amylovora by sequencing 16S rRNA gene and the adjacent intergenic region (Kim et al., 1999). E. pyrifoliae did not have biosynthetic genes for the production of levans, which are exopolysaccharides reported to contribute to virulence of E. amylovora (Gross et al., 1992). Moreover, E. pyrifoliae did not carry the plasmid pEA29 common to E. amylovora (Falkenstein et al., 1988).
Bacterial shoot blight in Nashi pears was observed in Japan in 1992 (Beer et al., 1996). Because symptoms were very similar to fire blight, scientists considered it as fire blight in the beginning. However, genetic analysis of Erwinia strains isolated from the symptoms by two different research groups showed that these strains were more similar to E. pyrifoliae (Kim et al., 2001; Maxson-Stein et al., 2003). In 2011, the complete genome sequence of Erwinia Japanese strain Ejp617 was reported (Park et al., 2011). Genome comparison also showed that this strain is more similar to E. pyrifoliae than E. amylovora. These might imply that bacterial shoot blight in Nashi pear observed in Japan might be black shoot blight.
So far, whole genome sequences of only two strains of E. pyrifoliae, Ep1/96 and DSM 12163 (or Ep16/96) isolated in 1996 have been revealed (Smits et al., 2010) and registered in National Center for Biotechnology Information (NCBI). Recently, we reported a new E. pyrifoliae strain EpK1/15 isolated from an apple twig showing black shoot blight in Pocheon, Gyeonggi-do, South Korea, in 2014 (Lee et al., 2018). Although there was comparative analysis performed for E. pyrifoliae and other Erwinia species or for other Erwinia species such as E. amylovora, E. tasmaniensis, and E. billingiae, so far comprehensive comparative genome comparison among E. pyrifoliae strains has not been performed yet (Kube et al., 2010; Mann et al., 2013; Zhao and Qi, 2011). Besides, there was no functional annotation for E. pyrifoliae genomes, but only statistics that compared with each genome.
In this paper, we compared the genomes of E. pyrifoliae EpK1/15 and Ep1/96, one of the previously sequenced strains, in order to see how much their genomes have changed for almost 20 years. To compare which functional features were conserved, the whole genomes of E. pyrifoliae Ep1/96 and EpK1/15 were classified with Clusters of Orthologous Groups of proteins (COG) (Tatusov et al., 2003). Prior to the functional classification, each protein sequence of predicted coding DNA sequences (CDSs) was compared to analyze the orthologs. Orthologs are defined as genes in different species that diverged at their speciation event and, therefore, directly derive from a single gene in their last common ancestor (Sonnhammer and Ostlund, 2015). Based on both similarities and differences, we also showed the natural variations between two strains, especially expected clues of horizontal gene transfer (HGT) in the genome of E. pyrifoliae EpK1/15.
Materials and Methods
Bacterial growth conditions.
The bacterial strains E. pyrifoliae EpK1/15 and Ep1/96 were grown in MGY agar plate (D-mannitol 10 g, L-glutamate 2 g, KH2PO4 0.5 g, NaCl 0.2 g, MgSO4•7H2O 0.25 g, yeast extract 0.25 g, and agar 15 g in 1 l, adjust pH 7.0) at 26°C for 2-3 days. For resistance or susceptibility to antibiotics, the bacterial strain was grown in LB (LPS Solution, Daejeon, Korea) agar plate with the indicated antibiotics: carbenicillin (100 μg/ml), ampicillin (100 μg/ml), kanamycin (50 μg/ml), and tetracycline (10 μg/ml).
Genome sequencing and annotation.
A detailed description of our approach for genome sequencing and annotation was previously published (Lee et al., 2018). Briefly, total genomic DNA of E. pyrifoliae EpK1/15 was extracted with the DNeasy Blood & Tissue Kit (Qiagen, Hilden, Germany). Then, the extracted DNA was used to generate 20-kb SMRTbellTM template libraries. Genome sequencing was performed at ChunLab, Inc. (Seoul, Korea) using the Pacific Biosciences RSII sequencing method. The sequencing depth was 272.82× coverage of the genome, and the sequence was assembled de novo into 2 contigs with the PacBio SMRT Analysis pipeline version 2.3.0. Automated annotation of genes in the resulting draft genome sequence was performed with the National Center for Biotechnology Information (NCBI) Prokaryotic Genome Annotation Pipeline (PGAP).
Orthology analysis.
E. pyrifoliae strains Ep1/96 and EpK1/15 were compared using InParanoid version 4.1 with default parameters to detect orthologous genes based on best reciprocal BLAST hits (Sonnhammer and Ostlund, 2015). All possible pairwise proteome combinations were run for individual protein sequences of predicted CDSs. It provides confidence scores for both the seed orthologs and the paralogs. To be considered as an orthologous group, all possible combinations of best reciprocal BLAST hits had to match in all pairwise comparisons within the group. Average Nucleotide Identity (ANI) values of E. pyrifoliae EpK1/15 and Ep1/96 were determined using the EzBio-Cloud ANI web-service (https://www.ezbiocloud.net/tools/ani) (Yoon et al., 2017). ANI values were calculated using the OrthoANIu algorithm.
Functional classification.
All protein sequences of predicted CDSs were BLASTed using DIAMOND for searching similarity (Buchfink et al., 2015) against the COG database (http://www.ncbi.nlm.nih.gov/COG/) (Tatusov et al., 2003). A match was counted if the similarity search resulted in an E value below 0.001. Since default e-value cutoff of BLAST is 10, DIAMOND searches a lot more stringently than BLAST by default parameters.
Comparative genomic analysis.
Bacterial Pan Genome Analysis (BPGA), a fast and efficient computational pipeline was used to draw a neighbor-joining phylogenetic tree (Chaudhari et al., 2016). CDSs of E. pyrifoliae EpK1/15, Ep1/96, and DSM 12163 and 17 strains of Erwinia species that had ‘complete genome’ assembly level in NCBI reference sequence database (Refseq) (Supplemantary Fig. 1) were clustered by USEARCH with identity cut-off at 90% (Edgar, 2010). This analysis utilized all default parameters. To visualize the relationships between the genomes of the E. pyrifoliae EpK1/15 and Ep1/96, the CIRCOS version 0.69-5 circular visualization of data tool was used (Krzywinski et al., 2009).
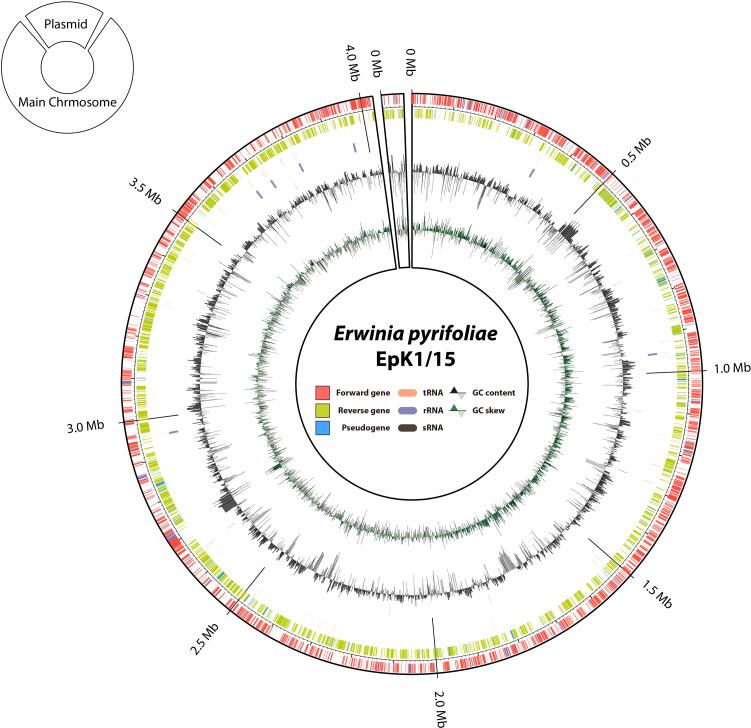
Circular visualization of the newly reconstructed genome of Erwinia pyrifoliae EpK1/15. Information from the outermost circle to the innermost circle provides the following data: (1) forward strand coding DNA sequences (CDSs) (red), (2) reverse strand CDSs (light green), (3) pseudogenes (sky blue), (4) tRNAs (apricot), (5) rRNAs (purple), (6) sRNAs (dark brown), (7) GC content (black and white triangle), (8) GC skew (green and light green triangle).
Results and Discussion
Genomic features of the newly reconstructed genome of E. pyrifoliae EpK1/15.
De novo genome sequencing for the E. pyrifoliae strain EpK1/15, which was isolated from apple twig showing black shoot blight, was performed with Pac-Bio single molecule real-time (SMRT) sequencing technology at ChunLab, Inc. The obtained long sequence reads were assembled with SPAdes 3.10.0 to result in 2 contigs. The newly assembled draft genome for E. pyrifoliae EpK1/15 consisted of one complete chromosome and one circular plasmid. The complete chromosome (CP023567) had a size of 4,027,225 bp with 53.41% of G + C content, and the plasmid (CP023568) was 48,456 bp with 50.25% of G + C content. In comparison with the older isolate E. pyrifoliae Ep1/96, EpK1/15 had a slightly longer chromosome than Ep1/96, which had a complete chromosome (NC_012214) of 4,026,322 bp (Kim et al., 1999), but the size difference was less than 1 kb (0.02%). In plasmids, E. pyrifoliae EpK1/15 took 3.99% longer plasmid than Ep1/96 (NC_013264, NC_013265, NC_013954, NC_0133263).
Genome annotation for E. pyrifoliae EpK1/15 was performed with PGAP (Tatusova et al., 2016). The genome consisted of 3,910 genes: 3,798 coding genes, 22 rRNA genes, 77 tRNA genes, 13 small RNA (sRNA) genes, and 231 pseudogenes (Fig. 1). Genomic comparison for two E. pyrifoliae strains revealed a similar characteristic of two genomes (Supplementary Table 1). However, there were different gene contents, which might contribute to different physiological characteristics of two isolates. One of which is the missing smaller plasmid in E. pyrifoliae EpK1/15. In conclusion, the genomic analysis revealed that E. pyrifoliae EpK1/15 is genetically similar to Ep1/96. However, more detailed comparative analysis is pivotal to understand possible traits of natural variations left in two genomes of E. pyrifoliae strains.
Comparative genome analysis with Erwinia species.
In order to investigate the evolutionary distance to existing strains including E. pyrifoliae Ep1/96, the comparative genome analysis was performed with the draft genome of E. pyrifoliae EpK1/15 strain. Currently, 2 genomes of E. pyrifoliae (Ep1/96 and DSM 12163), were released in the public database at NCBI (National Center for Biotechnology Information). Including the genome of the newly isolated E. pyrifoliae EpK1/15, a total 20 genomes with 9 E. amylovora strains, 3 E. pyrifoliae strains, 2 E. billingiae strains, 1 E. gerundensis strain, 1 E. persicina strain, 1 E. tasmaniensis, and 3 unidentified Erwinia sp. were analyzed for comparison with BPGA (Chaudhari et al., 2016). It seems that Erwinia species have open pan-genome (Supplementary Fig. 2). To measure phylogenetic relationships, the CDSs of each strains were used for phylogenetic analysis. For this analysis, the protein sequences of whole genomes of 20 strains of Erwinia species were obtained from NCBI database. Then, core genome sequences of individual strains were calculated. The resulting phylogenetic analysis indicated that 3 strains of E. pyrifoliae were distinguished from other Erwinia species (Supplementary Fig. 1). Since E. pyrifoliae is considered to have a restricted geographic distribution in East Asia and all 3 E. pyrifoliae strains were isolated in South Korea, we mainly compared E. pyrifoliae EpK1/15 strain with these 2 E. pyrifoliae strains. E. pyrifoliae DSM 12163 was excluded from our comparative genome analysis because of the low quality of the whole genome sequence. Furthermore, ANI value between E. pyrifoliae EpK1/15 and Ep1/96 was also calculated as much as 99.81% (Yoon et al., 2017). E. pyrifoliae strains are divided into two clades: E. pyrifoliae EpK1/15 and Ep1/96 were grouped to one clade, while only DSM 12163 was grouped to another clade (Supplementary Fig. 1).
In order to investigate the shared and unique genomic features of E. pyrifoliae EpK1/15, the genomes of EpK1/15 and Ep1/96 strains were compared to bidirectional-blast search with InParanoid (Sonnhammer and Ostlund, 2015). For this analysis, protein sequences of individual E. pyrifoliae strains were obtained from the complete genome sequences and their genome annotations. During evolution, functional genes can be changed to pseudogenes (Podlaha and Zhang, 2001). Moreover, in order to study mutation and tracing neutral evolution, pseudogenes are important sources that can provide useful data (Li et al., 1981). Therefore, pseudogenes were included in comparative genome analysis. Such sequence information was obtained from NCBI database for two E. pyrifoliae strains and also from analysis pipeline of ChunLab, Inc. for EpK1/15 strain. Then, those protein sequences for both E. pyrifoliae strains were incorporated to InParanoid. This analysis confirmed that E. pyrifoliae EpK1/15 is close to Ep1/96 strain. Overall, comparative genome analysis with those two E. pyrifoliae genomes indicated that they have 3,595 groups of orthologous genes in common, which accounted for as many as 94.66% of EpK1/15 CDSs and 94.98% of Ep1/96 CDSs, leaving only 393 genes unique (Fig. 2, Supplementary Table 2, Supplementary Fig. 3). In contrast, comparative genome analysis between E. pyrifoliae EpK1/15 and E. amylovora CFBP1430 showed that they have only 2,878 groups of orthologous genes in common, which accounted for 75.78% of E. pyrifoliae EpK1/15 CDSs and 82.61% of E. amylovora CFBP1430 (Supplementary Fig. 4).
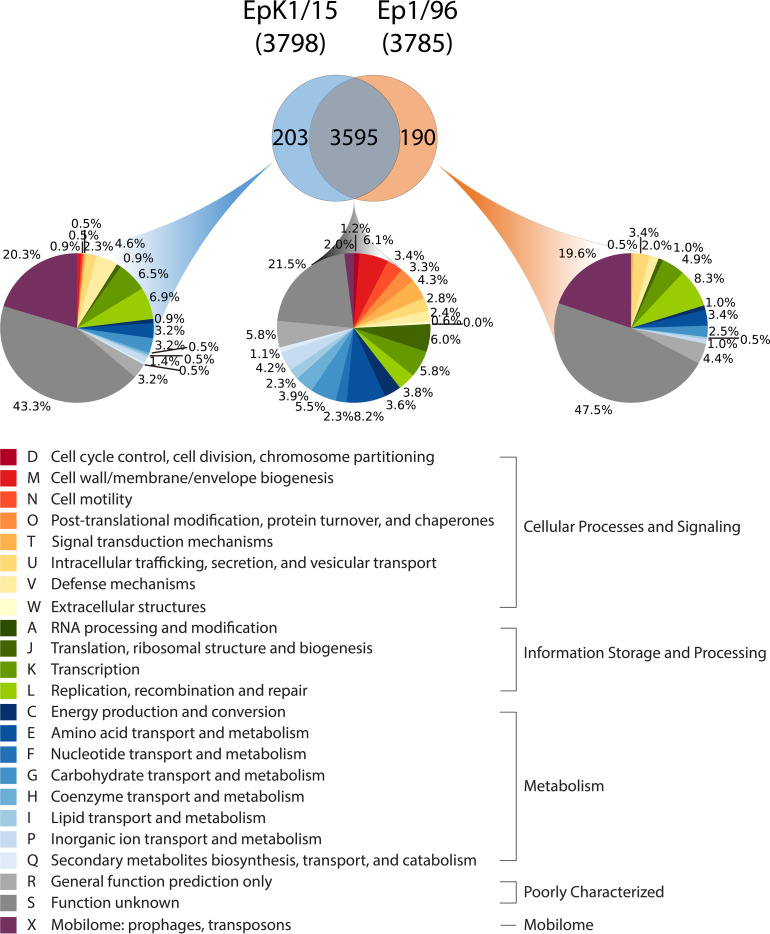
Functional classification of orthologous and non-orthologous coding genes between Erwinia pyrifoliae EpK1/15 and Ep1/96. The coding DNA sequences of both strains are divided into 2 groups. The functional category of each classification is derived from Clusters of Orthologous Groups of proteins (COG) database.
Functional analysis of the shared genes between E. pyrifoliae EpK1/15 and Ep1/96.
The comparative genome analysis revealed that the shared genome between E. pyrifoliae EpK1/15 and Ep1/96 contained a number of genes associated with common features, such as resistance to various stresses such as phages and antibiotics, Tn3 transposase of insertion sequences, type III secretion systems (T3SSs) as virulence factors, and sRNAs. Specific gene sets of E. pyrifoliae EpK1/15 (CPI84_10120-CPI84_10140) were annotated as phage shock protein operon pspFABCD induced by stress (Zhou et al., 2006), and the stress-related operon was shared in E. pyrifoliae Ep1/96 with high protein identity. Also, E. pyrifoliae EpK1/15 plasmid gene (CPI84_19405) encoding Tn3 transposase was orthologous with Ep1/96 plasmid gene (EPC_RS00065). Tn3 transposon encoded beta-lactamase gene that provides resistance to beta-lactam antibiotics. When E. pyrifoliae EpK1/15 and Ep1/96 were grown in plates with four antibiotics individually, both strains were resistant to ampicillin categorized together with cephalosporin, but somewhat less resistant to carbenicillin categorized together with penicillin (Supplementary Table 3). These phenotypes might be due to betalactamase gene in Tn3 transposon. Therefore, we expected that E. pyrifoliae EpK1/15 could be managed as the same way as E. pyrifoliae Ep1/96.
One of the important virulence factors of E. pyrifoliae EpK1/15 was T3SSs. T3SSs are crucial for pathogenicity of Gram-negative pathogenic bacteria (Tampakaki et al., 2010). All genes of T3SSs in E. pyrifoliae EpK1/15 were orthologous with Ep1/96 inversely. The genome of E. pyrifoliae EpK1/15 contained two distinct T3SSs (Fig. 3). Generally, in Gram-negative bacteria, hypersensitive response and pathogenicity (hrp) and hrp-conserved (hrc) genes are involved in forming T3SSs (Tampakaki et al., 2010). They provide a smooth passage to secrete effector proteins that help the bacteria to infect the host cells and to survive inside host tissues. The first T3SS was orthologous to the hrp/dsp cluster of E. amylovora (Fig. 3A), while the second was more similar to inv/spa-2 cluster of Salmonella typhimurium (McClelland et al., 2001) (Fig. 3B).
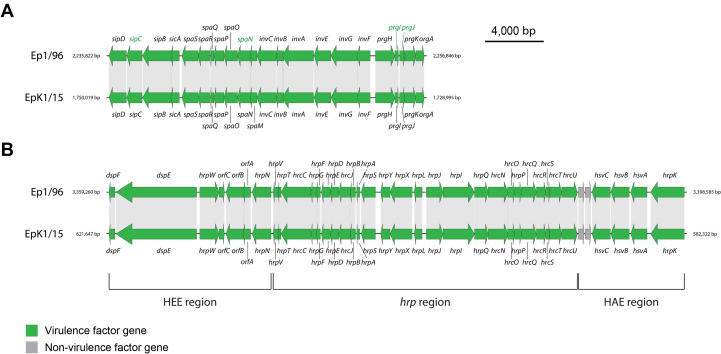
Conservation of key virulence factor clusters between Erwinia pyrifoliae EpK1/15 and Ep1/96. Two clusters participate in forming the type III secretion system (T3SS): inv/spa cluster and hrp/dsp cluster. Green arrows represent virulence genes. Grey arrows represent non-virulence genes. The genes that were orthologous have light grey shade connecting each other. Green letters indicate genes that get information from BLASTP with E. pyrifoliae DSM 12163. (A) Comparison of hrp/dsp clusters in E. pyrifoliae EpK1/15 and Ep1/96. (B) Comparison of inv/spa clusters in E. pyrifoliae EpK1/15 and Ep1/96. HEE, Hrp effectors and elicitors; HAE, Hrp-associated enzymes.
The hrp/dsp cluster is located on the pathogenicity island 1 (PAI-1) (Oh et al., 2005). It consists of 7 genes of Hrp effectors and elicitors (HEE) region (CPI84_02975-CPI84_03005), 25 genes of hrp region (CPI84_02850-CPI84_02970), and 6 genes of Hrp-associated enzymes (HAE) region (CPI84_02820-CPI84_02845). CPI84_03000, CPI84_02995, and CPI84_02945, representing dspA/E, hrpW and hrpN each in the HEE region, encode secreted proteins essential for virulence of E. pyrifoliae Ep1/96. CPI84_03005, CPI84_02990, CPI84_02985, and CPI84_02980, representing dspF, orfC, orfB, and orfA, are chaperone genes for the secreted proteins. It was known that products of the hrp-associated systemic virulence genes CPI84_02835, CPI84_02830, and CPI84_02825, representing hsvABC in the HAE region were required for systemic infection of host plants (Oh et al., 2005). The gene CPI84_02820, representing hrpK, encodes for a hrp/hrc type III effector HrpK. However, the role of HrpK in T3SSs is still unclear (Petnicki-Ocwieja et al., 2005).
The inv/spa-2 cluster for the second T3SS consists of 22 genes (CPI84_08590-CPI84_08695). Since the Refseq annotation of E. pyrifoliae Ep1/96 had less information of T3SSs sequence, GenBank annotations of that, which had both 100% coverage and protein identity, were also analyzed. In particular, certain genes of E. pyrifoliae EpK1/15 (CPI84_08635, CPI84_08655), which annotated as hypothetical proteins with uncharacterized functions, were orthologous to type III secretion apparatus genes (EPC_19930, EpC_19890) in E. pyrifoliae Ep1/96 with 100% coverage and protein identity. It was proposed that inv/spa-2 cluster of E. pyrifoliae Ep1/16 may play a role on facilitating vectoring associations with other hosts such as insects, though no evidence so far existed to prove that (Smits et al., 2010).
For non-coding genes, 13 sRNAs were predicted in E. pyrifoliae EpK1/15, using INFERNAL version 1.1.1 with Rfam database version 12.0 (Nawrocki et al., 2015). InParanoid was applied to compare surrounding coding genes flanking sRNA genes (Fig. 4). Since most orthologous genes of E. pyrifoliae EpK1/15 had inversion with E. pyrifoliae Ep1/96 as mentioned above, features on E. pyrifoliae EpK1/15 were inverted to show the relationship clearly (Fig. 4). The arrangement of sRNAs in E. pyrifoliae EpK1/15 was almost similar with those in Ep1/96 except RtT sRNAs. Seven groups including sRNAs that had structural homology to all the housekeeping sRNAs, rprA and two of RtT sRNAs, were maintained in E. pyrifoliae Ep1/96 (Fig. 4A). It seems that one RtT sRNA (CPI84_12955) was inserted to E. pyrifoliae EpK1/15, and another RtT sRNA of E. pyrifoliae Ep1/96 (EPC_RS19410) was replaced with tRNA on E. pyrifoliae EpK1/15 (CPI84_06360). However, the number of RtT had no change. Although it was thought that RtT sRNA might be involved in changing the response of a cell in relation to amino acid starvation, the exact function of RtT is unknown (Bösl and Kersten, 1991). Thus, we could not find any effects of sRNAs in the steps of natural variations in E. pyrifoliae EpK1/15. Additional analysis such as RNA-seq could be carried out to compare expression patterns of sRNAs and their flanking gene(s) to see their possible interactions.
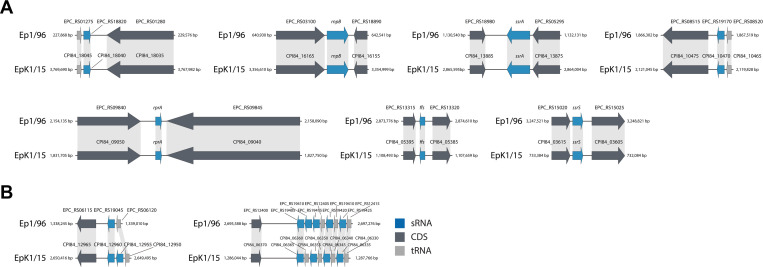
Conservational analysis of small RNAs (sRNAs) between Erwinia pyrifoliae EpK1/15 and Ep1/96. E. pyrifoliae EpK1/15 and Ep1/96 have the same number of sRNAs. However, a few of them are non-orthologous. Blue arrows indicate sRNAs. Dark grey arrows indicate coding DNA sequences (CDSs). Light grey arrows indicate tRNAs. The genes that were orthologous have light grey shade connecting each other. (A) Genomic comparison for orthologous sRNAs and their flanking regions. (B) Genomic comparison for non-orthologous sRNAs and their flanking regions.
The sRNAs could be divided into two subgroups based on their functions: the housekeeping sRNAs that affect different aspects of cellular metabolism and the regulatory sRNAs that act as regulators of gene expression (Hershberg et al., 2003). The four sRNAs CPI84_03610, CPI84_05390, CPI84_13880, and CPI84_16160, representing ssrS, ffs, ssrA, rnpB, are housekeeping sRNAs. These sRNAs except ssrS are essential for survival of cells (Hershberg et al., 2003). CPI84_09045, representing rprA, is a regulator of the stationary phase sigma factor RpoS, which regulates general stress responses such as osmotic shock (Majdalani et al., 2001). It seems that E. pyrifoliae EpK1/15 carries conserved sRNAs, which could affect various bacterial functions such as metabolism, housekeeping and stress responses.
Other major differences between E. pyrifoliae EpK1/15 and Ep1/96.
By analyzing differences between E. pyrifoliae EpK1/15 and Ep1/96, we could predict the trace of natural variations. As mentioned above, E. pyrifoliae EpK1/15 had fairly 5.34% non-orthologous genes with E. pyrifoliae Ep1/96. The BLASTP with COG database was conducted to predict protein functions through sequence similarity and to anticipate the evolutionary distance between E. pyrifoliae EpK1/15 and Ep1/96. To avoid errors in statistical analysis, the distribution of genes for categories of COG group was analyzed (Fig. 5, Supplementary Fig. 5). First, we showed that the number of genes representing COG category ‘X’, which are related to mobilome, had the most notable difference among non-orthologous genes. Transposase, integrase, and phage-related genes are the most well studied elements of mobilome. These are important drivers of HGT (Bozcal, 2019). Transposase is an enzyme required for transposition caused by transposon. The smallest and simplest form of transposon, insertion sequence (IS), typically only encodes a transposase flanked by terminal inverted repeats. E. pyrifoliae Ep1/96 seems to lack 17 out of 64 transposases compared to EpK1/15. The E. pyrifoliae EpK1/15 had 76 transposases consisted with eight IS family: IS110, IS256, IS3, IS481, IS630, ISL3, ISNCY, and Tn3. 22 of 76 transposase genes were non-orthologous with E. pyrifoliae Ep1/96. In both strains, most of non-orthologous genes were related to IS3 family transposase. Interestingly, the result of BLASTP in NCBI site showed that 6 of 22 non-orthologous transposase of E. pyrifoliae EpK1/15 had more than 75.13% coverage and more than 97.73% identity with Erwinia Japanese strain Ejp617, although one transposase (CPI84_07550) showed 100% coverage and 88.14% identity and the other transposase (CPI84_19385) showed 54.90% coverage and 92.86% identity with the Japanese strain. An interesting feature is that even Erwinia Japanese strain Ejp617 was isolated in Japan, and non-orthologous genes of E. pyrifoliae EpK1/15 showed the best matching with it. These tell us that there might be a possibility of HGT between two strains somehow, although it was not confirmed that each strain is present in either country.

Distribution of orthologous and non-orthologous genes between Erwinia pyrifoliae EpK1/15 and Ep1/96 for each Clusters of Orthologous Groups of proteins (COG) group. This analysis is based on the results of ortholog analysis that is shown in Fig. 2B, and alphabets indicate each COG group as function. Red rectangles indicate the numbers of coding DNA sequences (CDSs) in the orthologous group; Blue rectangles indicate the numbers of CDSs in the non-orthologous group.
To visualize the tendency of orthologous genes on the natural variations in E. pyrifoliae EpK1/15, we applied Circos plot analysis (Fig. 6, Supplementary Fig. 6) (Krzywinski et al., 2009). The Circos plot can suggest overview of difference of arrangement derived from transposition of orthologous genes between E. pyrifoliae EpK1/15 and Ep1/96. For many genomic modifications, recombinant junction could not be exactly identified due to inversion or loss or gain of one or more genes at the boundaries of the rearranged gene blocks. However, it seems that there were at least three kinds of genomic rearrangements such as chromosome inversion, translocation, and duplication in the steps of natural variations in E. pyrifoliae EpK1/15. The two modifications, chromosome inversion and translocation, are common, even between closely related species (Hughes, 2000).
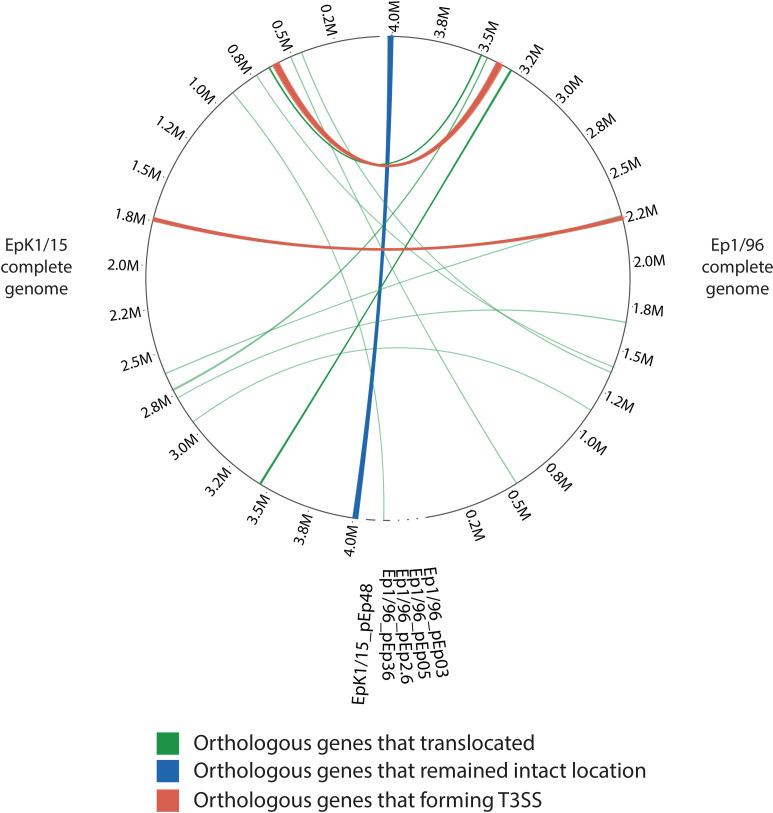
Comparison of genomic loci for orthologous genes presenting major differences between Erwinia pyrifoliae EpK1/15 and Ep1/96. The left semicircle shows whole orthologous genes of E. pyrifoliae EpK1/15, and the right one shows that of E. pyrifoliae Ep1/96. Genes in one strain are linked with other genes in another strain. The complete genome of E. pyrifoliae Ep1/96 is inverted to show relationship between both strains clearly. The outer number shows the position of each strain. The lines are divided into 3 types: (1) green lines are 24, (2) blue lines are 32, (3) orange lines are 60. If there were multiple corresponding genes, the representing one was linked. T3SS, type III secretion system.
Since 32 genes (CPI84_19125-CPI84_19280) near the origin of E. pyrifoliae EpK1/15 genome remained intact locations compared to Ep1/96 strain, it was thought that chromosome inversion occurred around terminus of E. pyrifoliae EpK1/15 genome through natural variations. It was known that gene inversion can increase evolvability and pathogenic capacity of bacteria through head-on replication-transcription collisions (Merrikh and Merrikh, 2018). Most orthologous genes of E. pyrifoliae EpK1/15 (3,478 CDSs) had an inverted order for Ep1/96. To show relationship between E. pyrifoliae EpK1/15 and Ep1/96 clearly, the order for the complete genome of Ep1/96 was inverted (Fig. 6, Supplementary Fig. 6). In addition, 32 orthologous genes of E. pyrifoliae EpK1/15 maintained the similar position with Ep1/96 at the end site. Twenty-eight of them had known functions, and four of them had uncharacterized proteins according to COG database (Supplementary Tables 4 and 5). The group of known function had COG category ‘M’, ‘J’, ‘C’, ‘F’, ‘G’, ‘H’, ‘P’ and ‘X’, more than half of these were associated with ‘metabolism’. The COG category ‘C’, related to ATP synthase, accounted for the highest ratio (32.14%) in the group. The COG category ‘J’ (related to ribosomal structure and biogenesis) and ‘P’ (related to ABC-type phosphate transport system) had second highest ratio (17.86%). Further studies need to determine which effective chromosome inversion gave during natural variations in E. pyrifoliae EpK1/15.
Second modification was gene translocation. Recombination between repeated sequences that are in the same direction as each other can introduce deletion of the sequences between them (Hughes, 2000). There is a possibility that the fragment was inserted back into the genome at the site of another copy of the repeat, thus emerging a translocation (Hughes, 2000). Twenty-four orthologous genes were translocated, 10 of which had known functions and 14 of which had uncharacterized proteins according to COG database (Supplementary Tables 6 and 7). The group of known functions had COG category ‘U’, ‘V’, ‘K’, ‘L’, and ‘X’. The two of orthologous genes (CPI84_13215, CPI84_16615) had two COG categories together; ‘R’ and ‘U’, ‘L’ and ‘X’. The COG category ‘X’, related to transposase, accounted for the highest ratio (41.67%). When the bacteriophage moves out to another place, it can come out with several parts of the genes of the surrounding phage genome, so it was considered that this was the reason that COG category ‘X’ took the highest ratio among COG categories of translocated ortholog genes. One orthologous gene was translocated from plasmids of E. pyrifoliae Ep1/96 (pEp36) to complete genome of EpK1/15. Nevertheless, it did not mean much, since it belonged to COG category ‘S’ related to function unknown. Further experiment should be performed to see the effect of translocation in E. pyrifoliae EpK1/15.
Gene duplication was the third modification. RecA protein can promote recombination between paralogs (Hughes, 2000). These can result in rearrangements in the order of genes on the chromosome. Thus, recombination between direct repeats can result in tandem duplication of the regions bounded by the repeat sequences (Hughes, 2000). These duplications are usually unstable; however, some duplications have been stabilized during evolution. It seems that E. pyrifoliae EpK1/15 had similar steps. The most interesting result was that there was tandem duplication including type II toxin-antitoxin (TA) system family once and after that, subsequent duplication of genes that passed through the tandem duplication might occur. The type II TA system family, which is composed of two genes encoding a toxin and an unstable antitoxin (Guglielmini and Van Melderen, 2011), were duplicated on chromosome several times during natural variations in E. pyrifoliae EpK1/15. It seems that one gene cluster of E. pyrifoliae EpK1/15 complete chromosome (CPI84_02515-CPI84_02565) were duplicated through tandem duplication event. The copied gene cluster (CPI84_02570-CPI84_02620) showed that the genes of an original cluster were duplicated at once. CPI84_02605 corresponding to CPI84_02550 took a deletion of guanine (G) during natural variations and became pseudogene. In addition, the two gene clusters, which were directly adjacent to each other, were suggested that they formed a new gene cluster and were duplicated again incompletely (CPI84_13160-CPI84_13265) and inverted. Similar to the previous case, CPI84_13180 corresponding to CPI84_02600 took deletion of 15 nucleotides (GCCGCCCCGTTGCCC), but the function of DNA primase was maintained. Although the functions of first 2 genes of the original cluster and the duplicated clusters (CPI84_02515-CPI84_02520, CPI84_02570-CPI84_02575, CPI84_13205-CPI84_13210, CPI84_13260-CPI84_13265) are still unknown, there was a possibility that it took a role related to some type II TA system. TA systems are part of mobilome and are known to move through HGT. Therefore, the increased number of type II TA systems could be one of the traces of HGT.
In addition, there was duplication of the gene cluster containing toxin of type II TA system in the plasmid during natural variations in E. pyrifoliae EpK1/15. One gene cluster (CPI84_19290-CPI84_19345), which is orthologous with that in pEP36, the longest plasmid of E. pyrifoliae Ep1/96, was duplicated completely (CPI84_19480-CPI84_19535). Interestingly, this gene cluster only contained genes encoding Type II TA system RelE/ParE toxin without antitoxin. Thus, it could contribute increased number of toxin in E. pyrifoliae EpK1/15.
Moreover, the previous research suggested that if antitoxin is decreased or expression of toxin was increased, antibiotic resistance would be reduced. E. pyrifoliae EpK1/15 had 26 genes of type II TA system containing 14 genes encoding toxin and 12 genes encoding antitoxin. On the other hand, E. pyrifoliae Ep1/96 had 11 genes encoding toxin and 10 genes encoding antitoxin. Although follow-up study will be needed, there is possibility that antibiotic resistance could be changed during natural variations in E. pyrifoliae EpK1/15 since the number of genes contributing to type II TA system were changed. Even TA systems are selfish genetic elements (Werren, 2011), so antibiotic resistance could be reduced.
Electronic Supplementary Material
Supplementary materials are available at The Plant Pathology Journal website (http://www.ppjonline.org/).
Acknowledgments
This work was supported by the “Cooperative Research Program for Agriculture Science & Technology Development (Project No. PJ014219022020)” of the Rural Development Administration, Republic of Korea.