


Faba bean (Vicia faba L.) is the most common fast food item in the Egyptian diet. It is an excellent source of protein and complex carbohydrates, dietary fiber, choline, lecithin, minerals and secondary metabolites (Ali et al., 2019; Rabey et al., 1992). Faba bean is subjected to attack by numerous pathogenic fungi wherever the crop is grown. Plant pathogenic fungi decrease crop productivity and lower the quality of seeds; it attacks the roots and stem base causing serious losses in seed germination and plant stand. Wilt disease incited by Fusarium oxysporum Schlecht. is one of the most important diseases affecting faba bean in the major growing areas of Egypt and causing serious losses on faba bean production (Abdul Wahid et al., 1998; Abou-Zeid et al., 1997; Ahmed et al., 2002; Elwakil et al., 2009; Mahmoud, 2016a; Mazen et al., 2008). Fusarium wilt (FW) of faba bean caused by F. oxysporum was first reported to occur in Egypt by Abdel Rehim (1962). It was found to be the causal pathogen of wilt of faba bean plants in many countries worldwide (Dong et al., 2014).
Cultivation of the resistant genotypes is the most effective method for integrated management of the disease and remarkable reduced the incidence of the wilt disease on faba bean. In this investigation, we aimed to detect some biochemical and/or molecular markers related to resistant genes for FW disease in some genotypes of faba bean. Therefore, these markers can be used in the early selection of resistant genotypes to provide the effort and cost resulting from the use of traditional breeding methods. Genetic variation among faba bean genotypes is imperative for their efficient utilization in plant breeding programs and effective conservation. Although traditional methods of screening plants for FW resistance are effective, they are time-consuming, expensive and affected by environmental factors. In such state of affairs, indirect selection using biochemical and/or molecular markers associated with resistance gene(s) could be an efficient method in marker-assisted selection to conquer the inexactness in the field evaluation (Tanksley et al., 1989).
Development of molecular markers provided reliable information for evaluating and assessing the genetic diversity of faba bean genotypes; random amplified polymorphic DNA (RAPD) (Alghamdi, 2009b; Yahia et al., 2014), inter-simple sequence repeat (ISSR) (Alghamdi et al., 2011; Terzopoulos and Bebeli, 2008), amplified fragment length polymorphism (Zeid et al., 2003), simple sequence repeat (SSR) (Tekalign et al., 2019; Tufan and Erdo─¤an, 2017; Yahia et al., 2014; Yang et al., 2012), and sequence related amplified polymorphism (SRAP) (Alghamdi et al., 2012; Mahmoud, 2016b). Molecular markers are sufficient in numbers, not influenced by environmental factors or by development stages (Bebeli and Kaltsikes, 1993).
In the present study, three molecular marker systems (ISSR, SRAP, and SSR markers) have been used to study genetic diversity and identify markers associated with FW resistance in tested faba bean genotypes.
These markers differ in technical principle, type of inheritance, reproducibility, distribution in the plant genome and amount of polymorphism (Li and Quiros, 2001; Provan et al., 1999; Zietkiewicz et al., 1994).
Okiror (2002) reported that the genetic basis of FW resistance is still not clear, and numbers of genes postulated to be involved vary from a single dominant gene to two complementary genes and even involvement of multiple factors. So, advent of genomic tools especially molecular markers has facilitated breeding in many crops leading to development of several improved cultivars/varieties with enhanced resistance/tolerance to biotic or abiotic stresses (Varshney et al., 2006).
SSR marker technique based on the use of microsatellite sequences as primers for amplification in the polymerase chain reaction (PCR) can be identified polymorphism around the disease-resistant (Zietkiewicz et al., 1994). The RAPD markers have been used successfully to tag various resistant genes in many crops like downy mildew resistance gene in broccoli (Giovannelli et al., 2002), powdery mildew resistance gene in pea (Srivastava et al., 2012), and YVMV resistance gene in mung bean (Dhole and Reddy, 2013). The ISSR technique has been used in tagging disease resistance genes in a number of crops (Reddy et al., 2002; Souframanien and Gopalakrishna, 2006).
Electrophoretic techniques present an exceptional opportunity to evaluate and study the protein structure among different genotypes.
The protein profiling of germplasm and genetic markers have been widely and effectively used to determine the taxonomic and evolutionary aspects of several crops, Vigna mungo (Ghafoor et al., 2002), Pigeonpea (Nagaraja et al., 2016), and Vicia faba (Abdel-Razzak et al., 2012; Alghamdi, 2009a).
Isozymes, peroxidase, polyphenol oxidase, superoxide dismutase, and pathogenesis-related proteins, such as chitinase and ╬▓-1,3-glucanase, have very important roles in resistance to plant pathogenic fungi (Prasad et al., 2003). Natural resistance is genetically controlled, and resistance genes are expressed through the production of biological products such as secondary metabolites, including phenolics, lignin, suberin, phytoalexins, alkaloids, terpenes, glycosides, degrading enzymes, and pathogenesis-related proteins, all of which contribute to disease resistance (Gupta et al., 2010).
We propose that the selection and propagation of resistant cultivars of faba bean could be an effective means for the management of FW disease and minimize the damage to this important crop.
The aims of this investigation were to (1) evaluate the response of different genotypes of faba bean to the wilt disease incited by Fusarium oxysporum; (2) detect the resistant faba bean genotypes for FW; (3) differentiate between 16 faba bean genotypes by ISSR, SRAP, and protein profiles; and (4) detect ISSR, SRAP, SSR, and protein markers associated with the FW resistance.
Materials and Methods
Source of isolates
Highly pathogenic isolate of Fusarium oxysporum (No. 10, which showed 73.75% disease severity according to the results of the previous study of Mahmoud, 2016a) was utilized in this study. The pathogen was previously isolated from naturally diseased faba bean plants, showing wilt symptoms. The diseased samples were collected from farmerŌĆÖs fields in Assiut Governorate, Egypt. The identification of the isolates was carried out based on the morphological features of mycelia and spores as well as cultural characteristics, the obtained isolates were identified as Fusarium oxysporum Schlecht. emend. Snyder & Hansen. according to Booth (1971), Gerlach and Nirenberg (1982), Kleczewski and Egel (2011) and Snyder and Hansen (1940).
Greenhouse experiment
Reactions of 16 faba bean genotypes were evaluated. The experiment was carried out in the greenhouse of Plant Pathology Department, Faculty of Agriculture, Assiut University, Egypt during two seasons in 2016-2017 and 2017-2018. Inoculums of Fusarium oxysporum was prepared by transferring agar pieces cut from the fungal culture into 500-ml Erlenmeyer flasks containing barley medium (100 g barley, supplemented with 2 g glucose + 1 g yeast extract + 100 ml distilled water) and incubated at 25 ┬▒ 2┬░C for 15 days. Sterilized pots (25 cm in diameter) were filled with sterilized sandy-loam soil which mixed thoroughly with equal amounts of F. oxysporum inoculums at the ratio of 2% soil weight, mixed well and thoroughly irrigated. Soil infestation was carried out one day before sowing seeds. Each pot was planted with 10 surface-sterilized seeds of faba bean. Seeds were surface sterilized by immersion in 0.5% solution of sodium hypochlorite for 2-3 min, then the seeds were removed, washed three times in distilled sterilized water, and air dried on the top layer of two sterilized filter paper sheets before sowing. Pots containing 2% non-infested barley medium were used as control. Four pots were used as replicates and randomly distributed on the greenhouse benches. The prevailing temperatures during the infection test were 15 ┬▒ 2┬░C (minimum) and 22 ┬▒ 2┬░C (maximum).
Disease assessment
Disease severity was estimated after 10 weeks from planting date, as a wilting percentage, on the basis of root discoloration or leaf yellowing. Plants with typical FW symptoms were assessed according to the type of symptoms that were observed using numerical grades ranging from 0 to 5 as follows (Mahmoud, 2016a): 0, no visible symptoms; 1, 1 to <20% of plant leaves are yellow and of the vascular systems are light brown (discoloration); 2, 20 to <40% of plant leaves are yellow and of the vascular systems are brown (discoloration); 3, 40 to <60% of plant leaves are yellow and of the vascular systems are dark brown (discoloration); 4, 60 to <80% of plant leaves are yellow and of the vascular systems are dark brown (discoloration); 5, 80 to Ōēż100% of plant leaves are yellow and of the vascular systems are dark brown (discoloration) or completely dead plants.
Where: N = the number of plants corresponding to the numerical grade, 0, 1, 2, 3, 4, and 5; 5T = the total number of plants (T) multiplied by maximum numerical grade (5).
Statistical analysis
The results were analyzed using ANOVA test and the means differences were regarded as significant using least significant difference test at 5% level of probability according to Gomez and Gomez (1984).
Molecular and biochemical analysis
DNA extraction
Total genomic DNA was extracted from young leaves of five plants each genotype following the CTAB method described by Murray and Thompson (1980) with minor modification of the extraction buffer (2% CTAB, 100 mM Tris-HCl pH 8.0, 20 mM EDTA, 1.4 M NaCl, and 0.06% ╬▓-mercaptoethanol added just before use). The quantity and quality of the DNA were measured using spectrophotometer at 260-280 nm and checked on 1% agarose gel.
ISSR, SRAP, and SSR analyses
Fifteen ISSR primers, 20 SRAP primer combinations, and 10 SSR primer pairs, obtained from Metabion International AG Company (metabion international AG/metabion GmbH, M├╝nchen, Germany), were tested in this investigation to amplify the template DNA (Supplementary Table 1).
Amplification reactions were carried out in a 25 ╬╝l volumes, containing 1├Ś reaction buffer, 0.2 mM of each dNTP, 2.0 mM MgCl2, 0.2 ╬╝M for (ISSR primer) or 0.3 ╬╝M of each of forward and reverse primer for (SRAP and/or SSR), 1.0 units of Taq DNA polymerase and 40 ng of genomic DNA template. Amplification conditions were carried out in a Lab Cycler (SensoQuest GmbH, G├Čttingen, Germany) with the following specification:
For ISSR; initial denaturation for 5 min at 94┬░C, 40 cycles of 1 min at 92┬░C, 1 min at 44┬░C and 2 min at 72┬░C, and final extension step for 10 min at 72┬░C.
For SRAP; 5 min at 94┬░C followed by 10 cycles: 1 min at 94┬░C, 1 min at 35┬░C and 2 min at 72┬░C then 35 cycles with 1 min at 94┬░C, 1 min at 50┬░C and 2 min at 72┬░C then finally extension for 10 min at 72┬░C.
For SSR; 5 min at 94┬░C (initial denaturation), 40 cycles of 1 min at 92┬░C, 1 min at 44┬░C and 2 min at 72┬░C, and final extension step for 10 min at 72┬░C.
The PCR products were separated in an Ultra-Pure agarose gel with different concentrations, 2% ISSR and 2.5% SRAP and SSR, at 80 volts for 3-3.5 h. Gels were stained with ethidium bromide (0.5 ╬╝g/ml) and DNA fragments were visualized using GelDoc-It 2 Imager (LTF Labortechnik GmbH & Co. KG, Wasserburg, Germany).
Data scoring and statistical analysis
The ISSR, SRAP, and SSR bands were scored as present (1) or absent (0) across 16 genotypes for each primer or primer combination. The three parameters viz., polymorphic information content (PIC), marker index (MI), and resolving power (RP), were calculated according to Ghislain et al. (1999), Powell et al. (1996), and Prevost and Wilkinson (1999), respectively.
A dendrogram was constructed based on Dice similarity coefficients (GS) (Dice, 1945) using the unweighted pair group method with arithmetic average (UPGMA) with the SAHN module of NTSYS-pc 2.20 (Rohlf, 2000).
Assessment of gene expression
Total soluble proteins and enzymes were extracted from infected and non-infected plants to study the changes in gene expression in resistant and sensitive genotypes response to infection with FW. Protein was extracted by crushing 1.0 g of sample tissue in 1.0 ml extraction buffer (0.1 M Tris-HCl + 2 mM EDTA, pH 7.8).
Protein analyses
Electrophoresis of protein patterns was separated on sodium dodecyl sulfate polyacrylamide gels (12%) according to Laemmli (1970) method. Coomassie Blue R stain was used to detect protein bands. Then, gels were destained by repeated immersions in a mixture of methanol: acetic acid: water (1:1:8, by volume). The molecular weight of protein bands was determined against protein markers which consisted of 175, 80, 58.46, 30, 27, 17, and 7.0 kD using GS 365 electrophoresis data system program version 3.01 (Microsoft Windows version).
Isozymes analysis
The gels were stained for two enzyme systems. The staining protocol for peroxidase (E.C. 1.11.1.7) was conducted according to Guikema and Sherman (1981). While, chitinase (E.C. 3.2.1.14) was stained according to the protocol described by Shen et al. (1991). Stained gels were placed in a light box to determine their isozyme banding patterns (BP). The isozyme band numbers were recorded, and their relative mobilities (RF) were calculated according to the following formula:
Finally, the correlation between the different molecular marker systems as well as between molecular markers and biochemical markers were calculated using Mantel test (Mantel, 1967).
Results
Reactions of faba bean genotypes for resistance to FW disease under greenhouse conditions
Faba bean production areas in Egypt adversely affected by FW incited by F. oxysporum. The adult plants become severely diseased at flowering to late pod-filling stage, resulting in dull green foliage color followed by wilting of whole plant or individual branches, and lower yields or death of affected plant. This study was determined to evaluate reaction of 16 faba bean genotypes against F. oxysporum, under greenhouse conditions during two seasons in 2016-2017 and 2017-2018. Results presented in Table 1 showed that all tested genotypes manifested visible symptoms of FW. Susceptible genotypes revealed remarkable significant differences than the resistant genotypes. This result indicated the importance to cultivate the resistant genotypes of faba bean that weak affected by F. oxysporum.
The percentage of wilt disease severity ranged from 32.83% for the resistant genotype Assiut-215 to 64.17% for the highly susceptible genotype Misr-3. None of the faba bean genotypes presented reaction similar to immunity to F. oxysporum and only four genotypes (Assiut-215, Roomy-3, Marut-2, and Giza-2) performed as resistant genotypes. Most of the tested genotypes were moderately resistant, while five genotypes (Misr-3, Misr-1, Assiut-143, Giza-40, and Roomy-80) were highly susceptible, with disease severity ranged from 60.43% to 64.17%. No symptoms were observed in non-inoculated plants (control).
Molecular analysis
Molecular polymorphism among 16 faba bean genotypes was assessed using three molecular marker systems including 45 primers. Out of 45 primers or primer pairs, 17 (37.78%) (6 ISSR, 6 SRAP, and 5 SSR) were polymorphic among all genotypes and were used for further analysis. In our study, the monomorphic primers or primer combinations were excluded from the analysis.
ISSR analysis
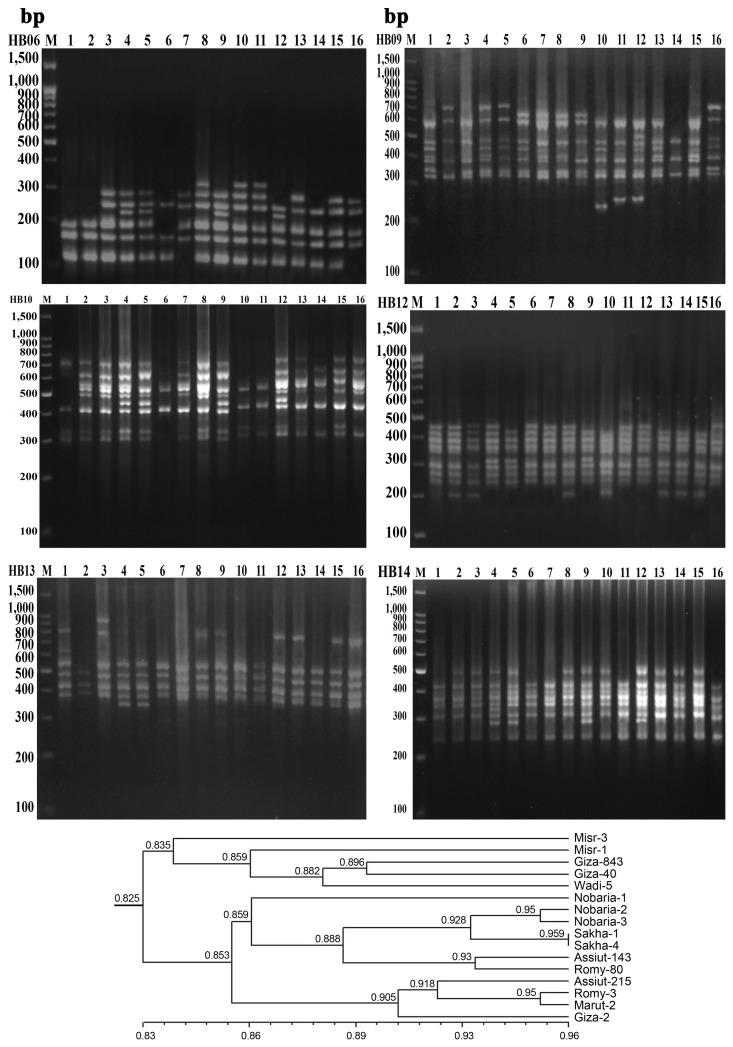
A total of 53 scored bands were generated using the ISSR primers previously screened across 16 faba bean genotypes (Fig. 1, Supplementary Table 2). The number of amplified bands per primer ranged from seven (HB13, HB06) to 12 (HB09) with an average of 8.83 bands per primer (Table 2). Of the 53 amplified bands, 33 (62.24%) were polymorphic, ranging from 3 (HB14, HB12) to 9 (HB09), with a mean of 5.5 polymorphic bands per primer. The percentage of polymorphic bands across the primers ranged from 33.33% (HB14, HB12) to 88.89% (HB10), with an average of 62.24% polymorphism. The primer HB10 exhibited the highest values (0.3, 2.42, and 3.88), while the primer HB14 showed the lowest values (0.1, 0.31, and 1.25) for the three primer parameters (PIC, MI, and RP, respectively) (Table 2).
GS coefficients obtained with UPGMA algorithm using Dice coefficient (Dice, 1945) ranged from 0.754 (Romy-3 and Misr-1) to 0.959 (Sakha-1 and Sakha-4). The dendrogram grouped the 16 genotypes into three main clusters (with a GS of 0.825) (Fig. 1).
SRAP analysis
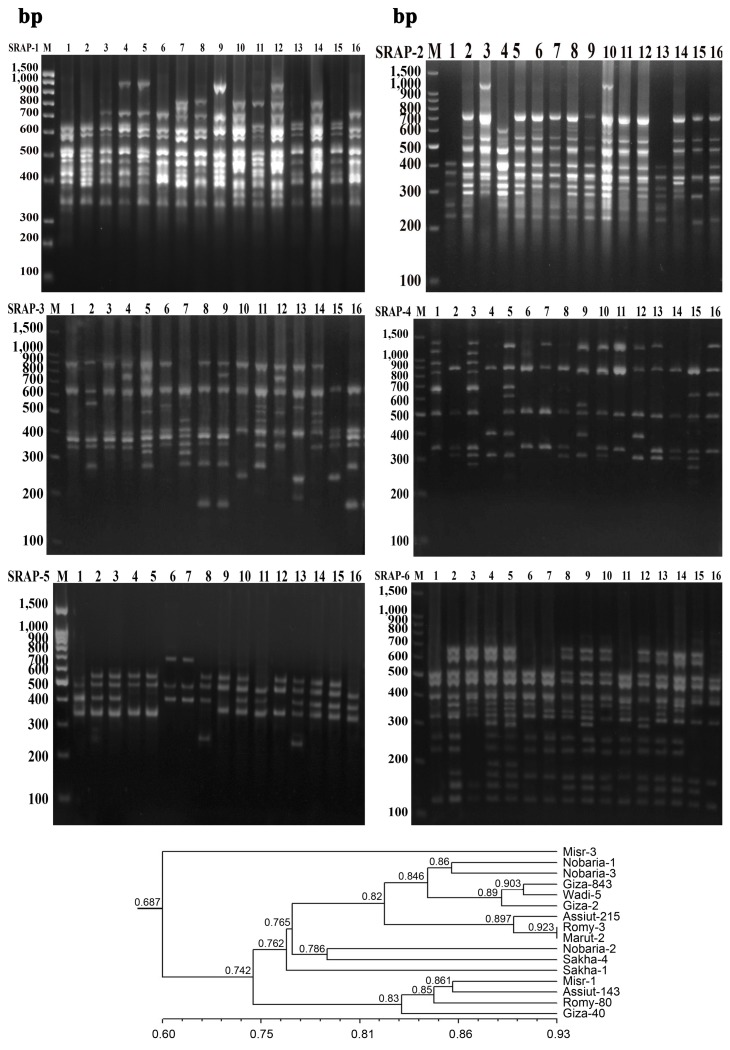
A total of 76 bands were observed using SRAP primer combinations (Fig. 2, Supplementary Table 3), of which 62 were polymorphic (82.53%), ranging from 5 (SRAP-5) to 13 (SRAP-3, SRAP-4) (Table 2). Average number of bands and polymorphic bands per primer combinations were 12.67 and 10.33, respectively. Percentage of polymorphic bands (PPB) ranged from 60% (SRAP-1) to 100% (SRAP-4) with an average polymorphism of 82.53% across all the genotypes (Table 2). The two SRAP primer combinations, SRAP-3 and SRAP-4 showed the highest PIC and MI values (0.28, 3.66 and 0.28, 3.64, respectively), while the two primer combinations, SRAP-3 and SRAP-6 exhibited the highest values for RP parameter (5.25 and 5.5, respectively) (Table 2).
SSR analysis
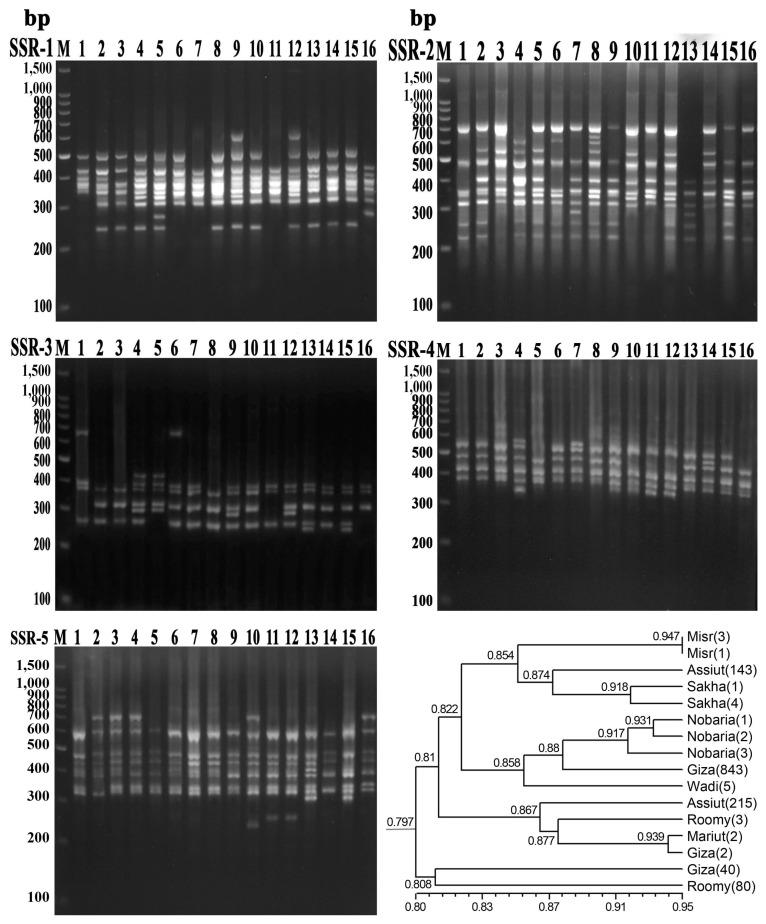
A total of 48 bands were amplified using SSR primer pairs (Fig. 3, Supplementary Table 4), of which 37 were polymorphic (76.85%), ranging from 5 (SSR-4) to 11 (SSR-2) (Table 2). Average number of bands and polymorphic bands per primer pairs were 9.6 and 7.4, respectively. PPB ranged from 63.64% (SSR-5) to 91.67% (SSR-2) with an average polymorphism of 76.85% across all the genotypes (Table 2). The SSR-2 primer pairs showed the highest mean values for three genetic parameters, PIC, MI, and RP (0.25, 2.74, and 4.13, respectively) (Table 2).
Combined ISSR, SRAP, and SSR data
To obtain more accurate genetic estimates, a combined analysis was carried out using all the ISSR, SRAP, and SSR data.
A total of 177 DNA fragments were obtained using ISSR, SRAP, and SSR markers used to screen 16 faba bean genotypes, with an average of 10.41 bands/primer. Out of 177 fragments, 132 (73.69%) showed polymorphism. The two genotypes Romy-3 and Giza-2 displayed the highest number of DNA fragments (126 bands) followed by Assiut-215 and Mariut-2 (125 and 122 bands, respectively), while the genotype Misr-3 revealed the lowest number of bands (93 bands).
The three molecular marker systems were successful in characterizing 13 out of the 16 faba bean genotypes by generating unique positive and/or negative markers (Table 3). The two genotypes Assiut-215 and Sakha-4 were distinguished by four unique bands for each, while the two genotype Nobaria-3 and Giza-843 had the highest positive unique bands (2 bands for each).
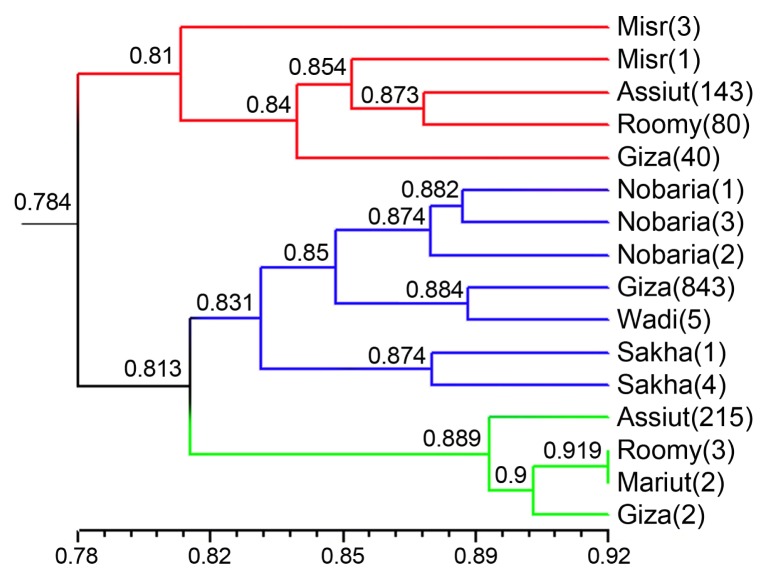
The Dice GS ranged from 0.725 (Misr-3 and Assiut-215) to 0.919 (Roomy-3 and Mariut-2) (Supplementary Table 5). The Dice GS matrix based on combined data was used to generate a dendrogram showing genetic relationships among the genotypes. The dendrogram grouped the 16 genotypes into three main clusters (Fig. 4). Cluster I included four genotypes (Assiut-215, Roomy-3, Mariut-2, and Giza-2) with GS 0.889, which showed resistance reaction for FW. Cluster II was the largest cluster consisting of seven genotypes and was further divided into three subclusters with a GS of 0.85. All genotypes in this cluster showed moderate resistance to the FW. Cluster III comprised of five genotypes (Misr-3, Misr-1, Assiut-143 Giza-40, and Roomy-80), with a GS of 0.81, which were highly susceptible to the FW.
The Mantel test performed between Dice similarity matrices obtained using ISSR, SRAP, and SSR markers showed significant correlations between ISSR + SRAP (r = 0.282), ISSR + SSR (r = 0.348), SSR + SRAP (r = 0.418), and SRAP + (ISSR + SSR) (r = 0.338), which indicated good agreement among ISSR, SRAP, and SSR markers.
Among the polymorphic bands, 10 DNA fragments, 457 bp (HB10), 209 bp (HB14), 312 bp (HB12), 219 bp (HB06), 984 bp (SRAP-1), 720 bp (SRAP-3), 401 bp (SRAP-4), 291 bp (SRAP-6), 419 bp (SSR-1), and 230 bp (SSR-3) were present in resistance faba bean genotypes, but absent in moderate and susceptible genotypes. The DNA fragment at molecular size 401 bp (SRAP-5) was present in moderate and susceptible genotypes, but absent in resistant genotypes. Eight DNA fragments, 498 bp (HB14), 289 bp (SRAP-2), 319 bp (SRAP-4), 561 bp (SRAP-5) and 656 bp, 593 bp and 146 bp (SRAP-6) and 498 bp (SSR-1) were present in all moderate and resistant genotypes, but absent in susceptible genotypes. These findings suggested that these fragments could be served as markers associated with the resistance to FW in faba bean.
These specific bands putatively associated with the FW resistance were subsequently screened against the highest resistant genotype (Assiut-215) and highly susceptible genotype (Misr-3). In general, 18 fragments, 457 bp (HB10), 209 bp (HB14), 312 bp (HB12), 219 bp (HB06), 984 bp (SRAP-1), 720 bp (SRAP-3), 401 bp (SRAP-4), 291bp (SRAP-6), 419 bp (SSR-1), 230 bp (SSR-3), 498 bp (HB14), 289 bp (SRAP-2), 319 bp (SRAP-4), 561 bp (SRAP-5) and 656 bp, 593 bp and 146 bp (SRAP-6) and 498 bp (SSR-1) were present only in resistant genotype, but absent in highly susceptible genotype. On the other hand, the DNA fragment at molecular size 401 bp (SRAP-5) was observed in susceptible genotypes but absent in resistant genotypes. To confirm the association of ISSR, SRAP, and SSR markers tested with the FW resistance, 30 individual plants of the resistant genotype (Assiut-215) and 30 individual plants of the highly susceptible genotype (Misr-3) were screened.
In general, the DNA fragments, 457 bp (HB10), 209 bp (HB14), 312 bp (HB12), 219 bp (HB06), 984 bp (SRAP-1), 720 bp (SRAP-3), 401 bp (SRAP-4), 291 bp (SRAP-6), 419 bp (SSR-1), and 230 bp (SSR-3) were found only in 29 (96.67%) of all individual resistant plants, but not observe in all susceptible plants. Eight DNA fragments, 498 bp (HB14), 289 bp (SRAP-2), 319 bp (SRAP-4), 561 bp (SRAP-5) and 656 bp, 593 bp and 146 bp (SRAP-6) and 498 bp (SSR-1) were generated in 28 (93.33%) of resistant plants while not amplified in susceptible plants. The DNA fragment at molecular size 401 bp (SRAP-5) was not observed in all resistant plants, while this fragment was generated in all susceptible plants. These findings confirmed that these bands could be considered as specific markers associated with the FW resistance in these genotypes.
Biochemical markers
Protein profiling
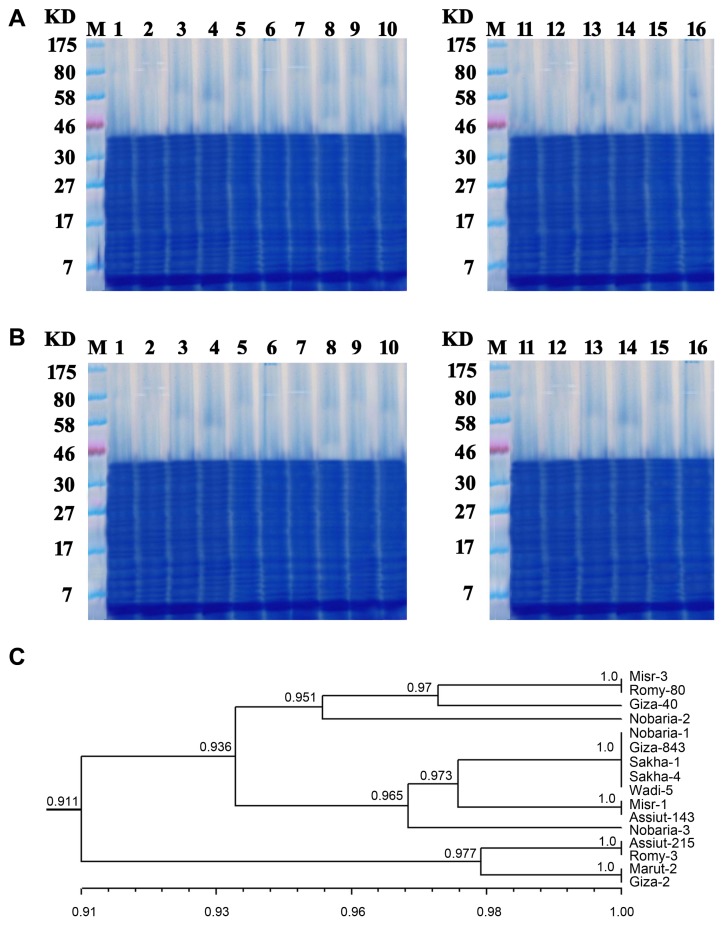
Sodium dodecyl sulfate-polyacrylamide gel electrophoresis (SDS-PAGE) of total soluble protein was carried out for the 16 faba bean genotypes uninfected (control) and infected with FW (Fig. 5A and B, Supplementary Table 6). For control; electrophoretic BPs produced a total of twenty-two total protein bands, ranged in sizes from 7.3 kD to 40.1 kD as shown in Fig. 5A. Out of 22 protein bands, seven bands were polymorphic (31.82%), while 15 (68.18%) were common bands for all the genotypes tested. The dendrogram using UPGMA analysis based on Dice GS of the protein profiles of 16 genotypes is shown in Fig. 5C. The GS varied from 0.842 to 1.0 (Supplementary Table 7). The 16 faba bean genotypes were grouped into three main clusters (with a GS of 0.687) (Fig. 5C). All resistant genotypes were grouped in cluster I, while all moderate and susceptible genotypes were separated in cluster II and cluster III.
Among polymorphic protein profiles, protein bands at molecular weights 30.1 kD and 10.2 kD were expressed only in all resistant genotypes, but not expressed in all moderate and susceptible genotypes. On the other hand, protein bands 21.4 kD was expressed in all moderate and resistant genotypes, but absent in highly susceptible genotypes.
For infected plants; a new protein band of molecular weight 26.2 kD induced in all faba bean genotypes infected with FW as compared with control plants (Fig. 5B). Also, new band of molecular weight 29.7 kD appeared only in all resistant genotypes infected with FW as compared with control plants. On the other hand, protein band of molecular weight 36.1 kD disappeared only in highly susceptible faba bean genotype infected with FW as compared with control plants. While protein band at 12.1 kD disappeared from all moderate and susceptible genotypes infected with FW as compared with control (Fig. 5B). Such protein bands, which appeared only in resistant genotypes infected and uninfected with FW, could be used as protein markers for FW resistant in faba bean genotypes.
Chitinase isozyme
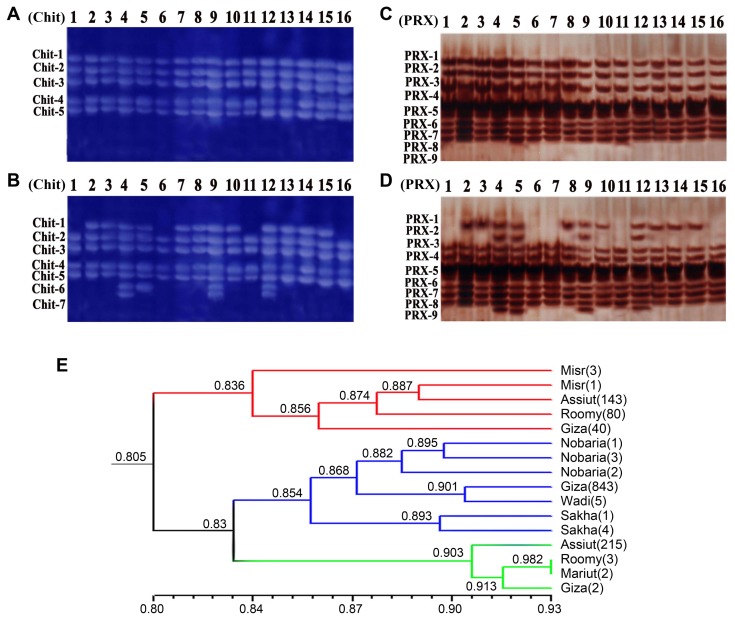
Seven chitinase isozyme patterns were expressed across control and infected faba bean genotypes (Fig. 6A and B). The four chitinase isozyme bands at RF values of 0.46, 0.53, 0.67, and 0.72 were monomorphic among all control and infected plants, while the three bands at RF values of 0.42, 0.77, and 0.82 were polymorphic. A chitinase band at RF value of 0.42 was found in all control and infected genotypes except the five genotypes, Misr-3, Misr-1, Assiut-143, Giza-40, and Romy-80. A band at RF value of 0.77 expressed only in the infected genotypes, Assiut-215, Romy-3, Maruit-2, and Giza-2 and it was not present in control and other infected genotypes. The chitinase band at RF value 0.82 appeared only in infected genotypes, Assiut-215, Maruit-2, and Giza-2 and it was not present in control and other infected genotypes.
Peroxidase isozyme
Peroxidase patterns showed nine bands at different RF values varying from 0.14 to 0.86, with four bands being polymorphic, and the other five bands at RF values of 0.41, 0.63, 0.69, 0.74, and 0.76 were found to be monomorphic among all control and infected faba bean genotypes (Fig. 6C and D). The peroxidase band at RF value of 0.14 appeared in all control and infected genotypes except five infected faba bean genotypes, Misr-3, Misr-1, Assiut-143, Giza-40, and Romy-80. The peroxidase band at RF values of 0.34 was found in all control plants and four infected genotypes. A band at RF value of 0.47 only appeared in the infected plants and was not present in control plants. The peroxidase band at RF value 0.86 appeared only in infected genotypes, Assiut-215, Romy-3, Maruit-2, and Giza-2 and it was not present in control and other infected genotypes.
Combined analysis based on molecular and biochemical markers
Based on combined analysis of ISSR, SRAP, SSR, protein patterns, and isozymes profiles, similarity matrix was developed by NTSYS-pc 2.20 computer package system (Rohlf, 2000). The Dice GS ranged from 0.74 (Assiut-215 and Giza-40) to 0.928 (Roomy-3 and Mariut-2) (Supplementary Table 8). The Dice GS matrix based on combined data was used to generate a dendrogram showing genetic relationships among the genotypes.
The dendrogram grouped the 16 genotypes into three main clusters (Fig. 6E). Cluster I included four genotypes (Assiut-215, Roomy-3, Mariut-2, and Giza-2), which showed resistant reaction for FW. Cluster II was the biggest cluster consisting of seven genotypes and was further divided into three sub-clusters with a GS of 0.868. All genotypes in this cluster showed moderate resistant to FW. The cluster III comprised five genotypes Misr-3, Misr-1, Assiut-143 Giza-40, and Roomy-80 with GS 0.836. These five genotypes in this cluster were highly susceptible for FW.
The Mantel test values between Dice similarity matrices of molecular markers showed significant correlations between ISSR + biochemical markers (r = 0.364), SRAP + biochemical markers (r = 0.451), SSR + biochemical markers (r = 0.611), and (ISSR + SRAP + SSR) + biochemical markers (r = 0.578) which indicated good agreement between biochemical and molecular markers.
Discussion
Faba bean is the most important food legume in Egypt and is widely grown in many areas of the world. FW of faba bean caused by F. oxysporum is an important vascular disease of the crop and considered as one of the major handicaps of production. It causes the plants to wilt and become less productive or even die. The cultivation of the resistant genotypes provides the most suitable method for control the disease and remarkable reduced the incidence of the wilt disease on faba bean. To select materials with potential for use in faba bean breeding programs and/or disease integrated management, 16 genotypes were evaluated for disease resistance in this study. The use of resistant cultivars is widely recognized as the safest, most economical and most effective method for protecting crops from disease (Johnson and Jellis, 1992).
Assessment of the genetic variability within a cultivated crop has important consequences in plant breeding and the conservation of genetic resources, and molecular and biochemical markers offer approaches to unveil the genetic diversity among genotypes based on polypeptide chains and nucleic acid polymorphisms. In the present study, protein profiles and three molecular maker systems, ISSR, SRAP, and SSR markers were applied to assess the level and pattern of genetic diversity of 16 faba bean genotypes. The results showed a wide genetic variability among different faba bean genotypes (Table 2). The polymorphism rate obtained using ISSR, SRAP, and SSR markers in the present study was higher than those obtained in other plant species including alfalfa (Vandemark et al., 2006), Paeonia (Hao et al., 2008), and buffalo grass (Budak et al., 2004). The high level of polymorphism indicates the genetic divergence among the studied genotypes, suggesting that these marker systems were ideal for the study of the genetic diversity among closely related genotypes. The applicability of ISSR, SRAP, and SSR as genetic markers to characterize the genetic diversity of faba bean was compared. SRAP markers showed higher PPB (82.53%) than the ISSR and SSR markers (62.24% and 76.85%, respectively). Moreover, the PIC, MI, and the RP were higher for SRAP than those obtained with ISSR and SSR markers (Table 2).
These results are relatively close with those of Terzopoulosa and Bebeli (2008) and Khalaf et al. (2015) they declared that the percentage of polymorphism within faba bean genotypes was 67.48% using ISSR primers. Similar results were also reported by Ammar et al. (2015) who found high polymorphism among faba bean genotypes using SRAP primers. These results also, in accordance with Tekalign et al. (2019) who study the genetic diversity among faba bean genotypes and found that the percentage of polymorphism was 68.5%.
The present study showed that the clustering of genotypes based on ISSR, SRAP, and SSR markers was slightly similar. The correlation between Dice similarity coefficients resulted in a significant correlation among ISSR, SRAP, and SSR data, indicated a good agreement among three molecular marker systems. Accordingly, Velasco-Ram├Łrez et al. (2014) recommended that the information that is generated by various markers had a valuable capacity for genetic studies involving both, diversity and relationships. By this criterion, the combining different marker system was critically better for the study of the diversity as recommended through numerous reports (Amar and El Wahab, 2013; Costa et al., 2016; Jhang et al., 2010; Velasco-Ram├Łrez et al., 2014; Wang et al., 2012).
Our results indicated the presence of a considerable genetic variability among tested faba bean genotypes. Genetic variation among faba bean genotypes based on ISSR, SRAP, and SSR analysis could be useful to select parents to be crossed for generating appropriate populations intended for both genome mapping and breeding purposes. The difference in resolution of three marker systems is that the three marker techniques targeted different sequences of the genome. The ISSR markers scattered throughout the genome which revealed the diversity of the entire genome, SRAP markers only amplified target sequence of open reading frame, while SSR marker target tandem sequence repeats of short DNA motifs (1-6 nucleotides long) (Li and Quiros, 2001; Provan et al., 1999; Zietkiewicz et al., 1994). Since each DNA maker system has its own advantages, it is important to use more than one DNA marker system, such as ISSR, SRAP, and SSR, in the analysis of genetic diversity. All three marker types were able to generate unique bands in particular genotypes but not in other genotypes. These unique bands could be used as positive and/or negative markers for this genotype.
Different kinds of electrophoretic methods based on protein patterns have been used for the identification and the characterization of cultivars (Y├╝zba┼¤─▒o─¤lu et al., 2008). Some researchers proposed that protein profiles may be useful as an indicator of taxonomic relationships within some species (Lioi et al., 2005), but others are of the opinion that this method is insufficient for discrimination at the cultivar level (Y├╝zba┼¤─▒o─¤lu et al., 2008). Our results revealed that SDS-PAGE of protein patterns gave specific BPs that distinguishing resistant faba bean genotypes from susceptible genotypes; however, the differentiations were not sufficient in distinguishing the genotypes. The results are in partial agreement with the findings of Alghamdi (2009a), Balkaya and Yanmaz (2002), and Duc (1997).
The results of the cluster analysis based on ISSR, SRAP, SSR, protein and combined ISSR + SRAP + SSR + protein data showed that the species obviously clustered into three major groups according to their resistance to FW. These results are in agreement with those obtained by Abdel-Razzak et al. (2012), who clarified that ISSR markers and protein analysis were helpful to recognize genetic variation among faba bean genotypes. The obtained results indicated management options for FW using resistant genotypes, especially genotypes Assiut-215, Roomy-3, Marut-2, and Giza-2. Resistance in these genotypes may be due to their genetic variations (Colditz et al., 2004; Mahmoud et al., 2015; Nyamsuren et al., 2003). These results also, in agreement with Kamboj et al. (1990) and Mahmoud et al. (2018) they mentioned that the inheritance of resistance to vascular wilt is controlled by independently segregating genes based on the reaction of individual plants.
In this study out of 132 polymorphic bands amplified by 17 markers; eight fragments generated by HB14 (498 bp), SRAP-2 (289 bp), SRAP-4 (319 bp), SRAP-5 (561 bp), SRAP-6 (146 bp, 593 bp, and 656 bp), and SSR-1 (498 bp) were present in all moderate and resistant genotypes, but absent in all highly susceptible genotypes. Furthermore, 10 DNA fragments, 457 bp (HB10), 209 bp (HB14), 312 bp (HB12), 219 bp (HB06), 984 bp (SRAP-1), 720 bp (SRAP-3), 401 bp (SRAP-4), 291 bp (SRAP-6), 419 bp (SSR-1), and 230 bp (SSR-3) were present in resistant faba bean genotypes, but absent in moderate and susceptible genotypes suggesting that these fragments could be considered as markers associated with the resistance to the FW in these genotypes. Moreover, these results indicate that the resistance genes present in faba bean genotypes may be different from each other. However, further genotyping is still required to validate the suitability of these markers for marker-assisted faba bean breeding. Similar results regarding genes responsible for the resistance to Fusarium vascular wilt were found by Eujayl et al. (1998), Rashid and Bernier (1993), and Rubio et al. (2003).
Our results in agreement with several reports in different crops, Parmar et al. (2009) reported the primer set SSR-67, a molecular marker linked to the FW disease resistance in tomato which could be employed for the discrimination of susceptible and resistant entity amongst the tomato population. Singh et al. (2013) analyzed genetic diversity among forty pigeonpea genotypes using 12 polymorphic SSR markers. They found that most of the FW resistant genotypes were grouped together in one cluster, and detected SSR markers associated with FW resistant. Mace et al. (2006) identified an association of eight SSR markers with rust and late leaf spot (LLS). While, Mondal and Badigannavar (2010) found three and four SSR markers associated with rust and LLS resistance in cultivated groundnut (Arachis hypogaea L.) germplasm, respectively. Singh et al. (2011) detected RAPD markers linked to FW resistance in castor bean (Ricinus communis L.).
Infection by pathogens can cause substantial biochemical alterations leading to harmful effects on plant health. Diseases may reduce plant growth and yield (Mofunanya and Edu, 2015). Because enzymes control biochemical reactions, and their synthesis is under the control of specific gene(s), any change in the activity and/or the number of BPs would reflect the pattern of gene expression and corresponding metabolic events in the cell (Neog et al., 2004).
Our study compared the SDS-PAGE protein patterns and isozyme bands of control and infected faba bean plants. The SDS-PAGE protein profile of total soluble protein from infected faba bean plants showed different band patterns from those of their respective control plants. Fusarium oxysporum infection caused disappearance of protein bands in some faba bean genotypes, while these bands were present in the control plants.
The absence of these protein bands in the infected plants can be explained as a result of the inhibition of the trigger for resistant gene transcription, which produces pathogen-related proteins, as previously reported by El-Khallal (2007).
On the other hand, some new protein bands were induced in infected plants, such that these bands act as a protein marker for resistance mechanisms allowing plants to become more resistant to the pathogens. Plants have flexible detection systems and most likely employ several recognition and signal transduction pathways to activate their defenses. Different types of proteins have been found to play specific roles in the plant defense mechanism and resistance to plant pathogens (Kumari and Vengadaramana, 2017).
Our results show that the, protein bands at molecular weights 30.1 kD and 10.2 kD were expressed only in all resistant genotypes, but not expressed in all moderate and susceptible genotypes. On the other hand, protein band 21.4 kD was expressed in all moderate and resistant genotypes, but absent in highly susceptible genotypes. For infected plants; protein band of molecular weight 26.2 kD induced in all faba bean genotypes infected with FW as compared with control plants (Fig. 4B). Also, new band of molecular weight 29.7 kD appeared only in all resistant genotypes infected with FW as compared with control plants. These findings suggested that these bands could be used as biochemical markers associated with the resistance to Fusarium vascular wilt in tested faba bean genotypes. These results are similar to the results obtained by El-Sayed (2006) who found that protein electrophoresis of two genotypes of faba bean infested with bruchid detected distinct bands which differentiated the most susceptible from the most resistant.
The induction of and changes in isozyme expression play important roles in the cellular defense against oxidative stress caused by pathogen infection (Almagro et al., 2009). Our results show that the isozyme patterns of peroxidase and chitinase of control and infected plants showed variations in BPs. New isozymes induced in infected plants were not observed in control plants. Furthermore, some isozyme bands disappeared in all or some infected faba bean genotypes. The induction of new isozymes in response to pathogen infection indicates that the induced isozymes have definitive roles in suppressing disease development in plant tissue. Several studies have investigated alterations in isozyme patterns in plants infected with different pathogens. Prasad et al. (2003) analyzed isozyme variability among Fusarium udum resistant cultivars of pigeon pea (Cajanus cajan L.). They concluded that the polymorphisms observed among isozymes such as peroxidases, phosphatases and esterases may be helpful in the characterization of resistance and susceptibility. Sahoo et al. (2007) indicated the presence of two new peroxidase bands in resistant genotypes of taro (Colocasia esculenta L.) under induced blight conditions. Saikia et al. (2005) analyzed chitinase isozymes in induced chickpea seedlings. They observed two chitinase isozyme bands were detected in diseased plants but not in healthy plants.
In conclusion, the present study reports genetic diversity of 16 elite faba bean genotypes, resistant/susceptible to FW. These genotypes were broadly grouped into two groups comprising most of the FW moderate and resistant genotypes into one group and susceptible genotypes in other groups. The present study revealed feasibility of prescreened ISSR, SRAP, SSR, protein, and isozyme markers to be used in genetic diversity analysis and their potential association with FW resistance. Diverse faba bean FW resistant/susceptible genotypes reported in this study will be useful to generate mapping populations for FW mapping and work in breeding programs for developed and release new resistant cultivars for Fusarium wilt.
 PDF Links
 PubReader
 Full text via DOI
 Full text via PMC
 Download Citation
 Supplement
 Print
Print