Evolutionary Rates and Phylogeographical Analysis of Odontoglossum Ringspot Virus Based on the 166 Coat Protein Gene Sequences
Article information
Abstract
Odontoglossum ringspot virus (ORSV) is a member of the genus Tobamovirus. It is one of the most prevalent viruses infecting orchids worldwide. Earlier studies reported the genetic variability of ORSV isolates from Korea and China. However, the evolutionary rate, timescale, and phylogeographical analyses of ORSV were unclear. Twenty-one coat protein (CP) gene sequences of ORSV were determined in this study, and used them together with 145 CP sequences obtained from GenBank to infer the genetic diversities, evolutionary rate, timescale and migration of ORSV populations. Evolutionary rate of ORSV populations was 1.25 × 10⁻³ nucleotides/site/y. The most recent common ancestors came from 30 year ago (95% confidence intervals, 26–40). Based on CP gene, ORSV migrated from mainland China and South Korea to Taiwan island, Germany, Australia, Singapore, and Indonesia, and it also circulated within east Asia. Our study is the first attempt to evaluate the evolutionary rates, timescales and migration dynamics of ORSV.
Due to the high error rates of RNA-dependent RNA polymerases (RdRp), RNA viruses harbor abundant genetic variability in their natural populations (Domingo and Holland, 1997; García-Arenal et al., 2001). The molecular evolution of plant viruses will help us to understand the phylogenetic relationships, epidemiological routes, population structure, the underlying evolutionary mechanisms of RNA viruses, and their ‘emergence’ as new epidemics, simultaneously, this understanding can be essential for designing strategies for controlling viruses (García-Arenal et al., 2001; Gibbs and Ohshima, 2010).
Odontoglossum ringspot virus (ORSV) belonged to the genus Tobamovirus, which is one of the most prevalent and economically important viruses infecting orchids worldwide (Jensen and Gold, 1951; Wong et al., 1994; Zettler et al., 1990). It has rod-shaped particles with a positive-sense single-stranded RNA genome. Similar to other tobamoviruses, ORSV encodes at least four proteins, such as the RdRp (126 kDa/183 kDa), movement protein (MP; 33 kDa MP), and coat protein (CP, 18 kDa) (Chng et al., 1996; Ryu and Park, 1995). ORSV induces ringspots, diamond-shaped mottle, and streaks or striped mosaicism symptom on leaves; and crinkle, color breaking and ringspots on orchids flowers (Jensen and Gold, 1951; Wong et al., 1994; Zheng et al., 2010). ORSV can be transmitted by mechanical inoculation with young infected leaves sap.
Earlier studies reported the genetic variability of ORSV isolates from Korea (Ajjikuttira et al., 2002; Yoon et al., 2011) and China (Rao et al., 2015). These showed high sequence conservation in CP gene. However, the evolutionary rate, timescale, and geographical adaptation analyses of ORSV were unclear. We report here that we have determined 21 CP sequences of ORSV collected in China and used them together with 145 CP sequences downloaded from GenBank to infer the evolutionary timescale, the degree of divergence and migration of ORSV populations in different countries.
Materials and Methods
Virus isolates
Cymbidium goeringii cultivar ‘Runmei’ and ‘Wang zi’ showing diamond-shaped mottle symptom were collected from commercial orchid plantations in Jiangsu province of China during 2017. The fresh leaves were assayed by reverse transcription polymerase chain reaction (RT-PCR) and double antibody sandwich enzyme-linked immunosorbent assay (Qiaodu, Shanghai, Japan), and the infected leaves were stored at −80°C until use. Details of the Chinese ORSV isolates, their place of origin, year of collection, original variety, symptom, and accession codes in DDBJ/EMBL/GenBank databases are shown in Supplementary Table 1, together with details of the isolates used in the analyses and for which CP sequences have already been reported.
Viral RNA and sequencing
We determined 21 CP sequences of ORSV collected in Jiangsu province of China. The viral RNAs were extracted from ORSV-infected C. goeringii leaves using TRIzol reagent (Invitrogen, Carlsbad, CA, USA). For cDNA synthesis and amplification of the CP gene, we used a PrimeScript II High Fidelity One Step RT-PCR kit (Takara, Dalian, China). The previously reported primers described by Rao et al. (2015) were used to amplify CP gene. The RT-PCR products were separated by electrophoresis in agarose gels and purified using the QIAquick Gel Extraction Kit (Qiagen, Beiing, China). The resulting fragments were cloned into the pGEM-T vector (Promega, Madison, WI, USA). The recombinant DNA was transformed into Escherichia coli DH5α. Sequences of CP gene of each isolate were determined using at least three independent cloned plasmids. Each clone was sequenced by primer walking in both directions using an automated DNA sequencer (ABI PRISMTM 3730XL DNA Analyzer). Sequence data were assembled using BioEdit version 5.0.9 (Hall, 1999).
Recombination analyses
The CP gene sequence of Bell pepper mottle virus (BPMoV, accession code: DQ355023) (Rhie et al., 2007) was used to align the ORSV CP sequences as BLAST searches had shown it to be the sequences in the international sequence databases most closely and consistently related to ORSV. Those were aligned with the CP sequences of BPMoV as the outgroup using CLUSTAL X2 (Larkin et al., 2007). However, this procedure resulted in some gaps that were not in multiples of 3 nucleotides (nts). Therefore the amino acid sequences corresponding to individual regions were aligned with the appropriate outgroups shown above using CLUSTAL X2 with TRANSALIGN (kindly supplied by Georg Weiller) to maintain the degapped alignment of the encoded amino acids and then the aligned subsequences were reassembled to form CP sequences 468 nt long. Putative recombination sites in all sequences were identified using RDP (Martin and Rybicki, 2000), GENECONV (Sawyer, 1999), BOOTSCAN (Salminen et al., 1995), MAXCHI (Smith, 1992), CHIMAERA (Posada and Crandall, 2001), and SISCAN programs (Gibbs et al., 2000) implemented in the RDP4 package (Martin et al., 2015) and also the original SISCAN version 2 (Gibbs et al., 2000) programs. First, we checked for incongruent relationships using the programs implemented in RDP4. These analyses were done using default settings for the different detection programs and a Bonferroni corrected P-value cut-off of 0.05 or 0.01, and then all isolates that had been identified as likely recombinants by the programs in RDP4, supported by three different methods with an associated P-value of < 1.0 × 10⁻⁶, were rechecked using the original SISCAN version 2. We checked 50 nucleotides slices of all sequences for evidence of recombination using these programs. These analyses also assessed which non-recombinant sequences had regions that were the closest to the regions of the recombinant sequences and hence indicated the likely lineages that provided those regions of the recombinant genomes. For convenience, we called them ‘parental isolates’ of recombinants. Having examined all sites with an associated P-value of < 1 ×10⁻⁶ (i.e., the most likely recombination sites) (Tomitaka and Ohshima, 2006). The ORSV CP sequences were also aligned without an outgroup sequence and directly checked for evidence of recombination using the programs.
Phylogenetic analysis
The CP gene sequences of the ORSV isolates, together with that of BPMoV isolate, as outgroup, were aligned, as described above using CLUSTAL X2 with TRANSALIGN. The phylogenetic relationships of the aligned sequences were inferred by the maximum-likelihood method (ML) implemented in PhyML version 3 (Guindon and Gascuel, 2003). The best-fit model of nt substitutions for CP dataset was determined by jModeltest 0.1.1 (Posada, 2008); the general time-reversible substitution model with a gamma distribution of among-site rate variation (GTR + T4) provided the best fit for the data set. For ML tree, branch support was evaluated by the bootstrap method based on 1,000 pseudoreplicates. While the neighbor-joining (NJ) tree was also constructed using MEGA version 7 (Kumar et al., 2016) with 1,000 bootstrap replicates. The calculated trees were displayed by TREEVIEW (Page, 1996).
Similarity, variation, and selection
The SDT version 1.2 software was used to estimate the pairwise nucleotide sequence identity scores (Muhire et al., 2014). The genetic distances (the average number of nt substitutions between two randomly selected sequences in a population) of the CP gene within and between geographic and phylogenetic groups were calculated also using Kimura’s two-parameter correction method (Kimura, 1980) in MEGA version 7 (Kumar et al., 2016). Nonsynonymous (dN) and synonymous (dS) differences that correlated with phylogenetic relationships were accessed separately using the Pamilo–Bianchi–Li method (Pamilo and Bianchi, 1993) in MEGA version 7 (Kumar et al., 2016). Nucleotide and haplotype diversity of ORSV CP sequences were estimated by DnaSP version 6.0 (Rozas et al., 2017). Haplotype diversity was calculated based on the frequency and number of haplotypes in the population. Nt diversity estimates the average pairwise differences among sequences.
Genetic differentiation and gene flow
The three values of Ks*, Z, and Snn were used to examine the genetic differentiation between populations based on permutation statistical tests. To detect the level of gene flow between populations, the absolute value of the standardized variance in allele frequencies across populations (Fst) were estimated using DnaSP version 6.0 (Rozas et al., 2017). The absolute value of Fst ranges from 0 to 1 for undifferentiated to fully differentiated populations.
Estimation of the substitution rates, divergence times and spatial diffusion
BEAST v1.8.2 was used to estimate the evolutionary rate and timescale of the ORSV using the CP gene. Recombinant sequences were discarded. Bayes factors were used to select the best-fitting molecular-clock model. We compared strict and relaxed (uncorrelated exponential and uncorrelated lognormal) molecular clocks, as well as five demographic models (constant population size, expansion growth, exponential growth, logistic growth, and the Bayesian skyline plot). Posterior distributions of parameters, including the tree, were estimated by Markov chain Monte Carlo (MCMC) sampling. Samples were drawn every 104 MCMC steps over a total of 108 steps, with the first 10% of samples discarded as burn-in. Acceptable sampling from the posterior and convergence to the stationary distribution were checked using the diagnostic software Tracer version 1.6 (http://tree.bio.ed.ac.uk/software/tracer/). For reliable rate estimates from time-structured sequence data, the spread of sampling times needs to be sufficient to allow an appreciable number of substitutions to occur. The temporal signal in our data sets was checked by comparing our rate estimates with those from 10 date-randomized replicates. A data set was considered to have an adequate spread in sampling times when its mean rate estimate was not contained in any of the 95% confidence intervals (CIs) of the rates estimated from replicates with randomized dates (Ramsden et al., 2009).
The spatial diffusion patterns of ORSV were inferred in BEAST using an asymmetric discrete-time Markov chain phylogeographic mode (Lemey et al., 2009). Seven geographical locations including mainland China, Germany, Australia, Singapore, South Korea, Indonesia, and Taiwan island, were selected and coded as discrete states. The migration pathways between pairs of locations can be identified by using Bayes factors > 10 and a mean indicator of > 0.5 (Suchard et al., 2001). The well-supported spatiotemporal movements of ORSV were identified using SPREAD v 1.0.7 (Bielejec et al., 2011) and Google Earth (http://www.google.com/earth).
Results
Nucleotide sequences
Twenty-one CP nt sequences of ORSV were determined here (Supplementary Table 1). In all the ORSV isolates sequenced in this study, the CP gene was 477 nt in length with 158 deduce aa. The CP sequences determined in this study are available in DDBJ/EMBL/GenBank databases with accession codes MG869629–MG869649. Three highly conserved RNA-binding motifs (I, II, and III) in tobamoviruses (Altschuh et al., 1987; Chng et al., 1996) were also observed from these ORSV CP gene sequences.
Recombination and phylogenetic analysis
Total 166 CP sequences obtained here and the public DNA sequence databases, were assessed for the evidence of recombination. After all gaps and nts homologous to them were removed from the aligned sequences, the likely recombination sites were assessed using RDP4 package and original SISCAN version 2 program. However, no recombination site was found in the CP gene region of all ORSV isolates. We calculated the ML and NJ trees based on the CP sequences of ORSV isolates, respectively. The ML tree is shown in Fig. 1. All ORSV isolates were clustered into one lineage, which is partially congruent with geography origin.
Maximum-likelihood tree calculated from the coat protein gene sequences of Odontoglossum ringspot virus (ORSV). Numbers at each node indicate the percentage of supporting bootstrap samples in maximum-likelihood trees. The homologous sequences from an isolate of Bell pepper mottle virus (BPMoV) were used as outgroups.
Variation analysis
The similarities between the isolates in CP gene were 0.00823 (standard error, ±0.00132) in nt sequences (Table 1). The nucleotide pairwise genetic identities of ORSV isolates in CP gene were calculated by SDT software. The lowest pairwise identity was approximately 94% (Supplementary Fig. 1). We also calculated the nt similarities within and between the Chinese, South Korean, German, Singaporean, Indonesian, and Japanese subpopulations (Table 2). The nt similarity for CP gene in China showed the lowest values (0.00468) except in Japan where only four isolates were included in this study. The highest nt similarity was found in Indonesia (0.0252). The results suggest that there was small genetic differentiation in the CP gene between the geographic regions. Haplotype diversities of the geographic origined subpopulations were also compared (Table 1). In most cases, haplotype diversity values are high and nt diversity values are low except Japanese subpopulation.
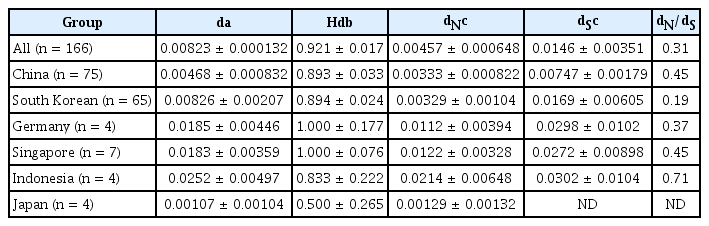
Nucleotide and haplotype diversities of the CP genes of Odontoglossum ringspot virus isolates

With- and between-subpopulation nucleotide diversities in the coat protein gene region of Odontoglossum ringspot virus
Selection
The number of dN was always smaller than dS and varied considerably in Chinese, South Korean, German, Singaporean, Indonesian, and Japanese subpopulations. This suggests that there is selection against (i.e., negative selection) most amino acid changes. We estimated the dN/dS ratios within the geographic origined subpopulations. The South Korean subpopulation had the highest selective constraints (0.1945), while the lowest ratios (0.7095) were found in Indonesia (Table 1). These results were consistent with the nt diversity analysis.
Genetic differentiation and gene flow
The Ks*, Z, and Snn values of population differentiation supported that there has been partial genetic differentiation between Chinese, South Korean, German, Singaporean, Indonesian, and Japanese subpopulations, consistently with the results of the phylogenetic analyses (Table 3).

Gene flow and genetic differentiation of Odontoglossum ringspot virus populations
The absolute values of Fst are used to analyze the level of gene flow between different geographical subpopulations (Table 3). In the present study, the absolute values of Fst were smaller than 0.33, suggesting that the gene flow of ORSV subpopulations among China, South Korea, Germany, Singapore, and Indonesia were frequent in CP gene. However, the absolute values of Fst for Japan with Chinese, South Korean, German, and Singaporean subpopulations were > 0.33, and this suggests that gene flow between the Japanese subpopulation and the other subpopulations are infrequent.
Evolutionary rates and timescales
We used a Bayesian phylogenetic method to estimate the evolutionary rates and timescales for ORSV CP gene. Based on a comparison of marginal likelihoods calculated using the harmonic-mean estimator in Tracer version 1.6 (http://tree.bio.ed.ac.uk/software/tracer/), the Bayesian skyline plot demographic model was the best support for ORSV. An uncorrelated lognormal relaxed-clock model provided a better fit than the strict-clock model, indicating the presence of rate variation among lineages. Our analyses of date-randomized replicates revealed that the sampling times of ORSV had sufficient temporal structure for calibration of the molecular clock (Supplementary Fig. 2). This was indicated by the smaller 95% credibility intervals of the rate estimates from the original data set compared with the date-randomized replicates (Ramsden et al., 2009). In addition, the mean posterior rate estimates from the original data were not contained with the 95% credibility intervals of the rate estimates from the date-randomized replicates (Ramsden et al., 2009). The mean estimated substitution rates was 1.25 × 10⁻³ nt/site/y for CP. Estimates of the age of the root was 30 y (95% CI, 26–40) for CP (Fig. 2).

Bayesian maximum–clade–credibility tree inferred from 166 sequences of the coat protein (CP) gene of Odontoglossum ringspot virus. The tree topology has been chosen to maximize the product of node posterior probabilities. Only posterior probability values above 0.90 are shown. The bar graph shows the root state posterior probabilities for each location. Isolates with red cycle are of Chinese origin and had their CP coding regions sequenced in this study. Year before present; 2017.
Geographical spread of ORSV
We assessed the likely migration routes of ORSV into mainland China, Germany, Australia, Singapore, South Korea, Indonesia, and Taiwan island according to the non-recombinant sequences of the CP gene using a Bayesian phylogeographical analysis (Lemey et al., 2009). Our results showed that ORSV migrated from east Asia countries (mainland China and South Korea) to Taiwan island, Germany, Australia, Singapore, and Indonesia (Fig. 3, Supplementary Table 2), and it also circulated within mainland China and South Korea, based on the CP data set. These results were confirmed by the gene flows and ML trees of the CP gene. The absolute values of Fst among mainland China, South Korea, Taiwan island, Singapore, and Indonesia populations were all < 0.33 based on the CP gene (Table 3), which supported the frequent gene flows in east Asian, Germany, and Australia populations. In the CP ML tree, the Chinese and Korean isolates were closest to the German, Indonesian, Singaporean, and Australian isolates (Fig. 1), which also supported the probable migration routes.
Spatial diffusion pathways of Odontoglossum ringspot virus that were inferred using the coat protein gene sequences using nonrecombinant sequences. Dissemination routes are only shown when supported by a Bayes factor (BF) > 10 and a mean indicator > 0.5. BF values can be interpreted as follows: 10 ≤ BF < 30, strong support; 30 ≤ B < 100, very strong support; and BF ≥ 100, decisive support.
Discussion
ORSV inducing viral diseases have been found in worldwide (Hu et al., 1993; Jensen and Gold, 1951; Pearson and Cole, 1986). The only effective control of ORSV is through the use of host plant genetic resistance, either conventional or transgenic (Ajjikuttira et al., 2002; Yoon et al., 2011). Hence, it is very important to understand the molecular variability, divergence, and migration of ORSV population in each region.
Recombination is an important source of genetic variation not only for potyviruses (Gibbs and Ohshima, 2010) but also for the viruses in the genus Tobamovirus (He et al., 2012; Lartey et al., 1996). However, the ORSV isolates in CP gene used in the study seemed to be non-recombinants, although previous report shown that homologous recombination had played a role in ORSV evolution (Lartey et al., 1996). The phylogenetic analyses together with the genetic differentiation analyses indicate that ORSV has a structure in China, South Korea, Germany, Singapore, Indonesia, and Japan. The varied dN/dS ratios obtained from Chinese, South Korean, German, Singaporean, Indonesian and Japanese subpopulations, also indicating that the ORSV CP gene is under different evolutionary constraints according to the geography. Analogously, there has been reported in several plant viruses where strong selection against amino acid change in the CP gene (Ge et al., 2014; He et al., 2014, 2016; Ogawa et al., 2008; Ohshima et al., 2016; Wei et al., 2009).
Recently, the evolutionary rates and the most recent common ancestors (TMRCAs) have been analyzed for Tobacco mosaic virus (TMV) (Gao et al., 2019), and flowers plant viruses (Ohshima et al., 2016). We estimated evolutionary rates and TMRCAs for ORSV. Ohshima et al. (2016) analyzed the evolutionary rates of five narcissus viruses were 1.33–7.15 × 10⁻³ nt/site/y, while the four genes evolutionary rates of TMV were 3.92–4.38 × 10⁻⁴ (Gao et al., 2019). Our analysis showed that ORSV had similar evolutionary rates with these narcissus viruses, but slightly faster than TMV. TMRCAs of ORSV was similar to Narcissus degeneration virus and TMV, but younger than Narcissus late season yellows virus, Narcissus yellow stripe virus, Cyrtanthus elatus virus A, and Narcissus latent virus (Gao et al., 2019; Ohshima et al., 2016).
ORSV was first isolated from Rossioglossum grande in the early 1950s (Jensen and Gold, 1951). TMRCAs of ORSV (1977–1983) that was estimated here corresponds very closely to the timing of the virus emergence dates. The natural host range of ORSV is known to be limited to monocotyledonous orchid plants. Mark (2001) showed the family Orchidaceae is even older up to roughly 100 million years. Thus, our TMRCAs analysis indicated that the earlier ORSV populations were either not sampled or did not survive to the present day, which is similar to the recent estimate for Potato virus S (Duan et al., 2018).
In conclusion, the CP gene of ORSV is evolving at a rate of 1.25 × 10⁻³ nt/site/y, which is similar to that of RNA and ssDNA viruses. TMRCAs of CP gene was 30 y (95% CIs, 26–40). ORSV migrated from east Asia countries (mainland China and South Korea) to Taiwan island, Germany, Australia, Singapore, and Indonesia, and it also circulated within mainland China and South Korea. Our analysis of ORSV isolates from worldwide countries provides useful information about the evolution and genetic conservation of the viruses in the genus of Tobamovirus.
Supplemental Materials
Acknowledgments
This work was supported by grants from the Key project at central government level: The ability establishment of sustainable use for valuable Chinese medicine resources (2060302), National Natural Science Foundation of China (No. 31601604) and China Agriculture Research System (CARS-24).
Notes
Electronic Supplementary Material
Supplementary materials are available at The Plant Pathology Journal website (http://www.ppjonline.org/).