 |
 |
| Plant Pathol J > Volume 29(1); 2013 > Article |
Abstract
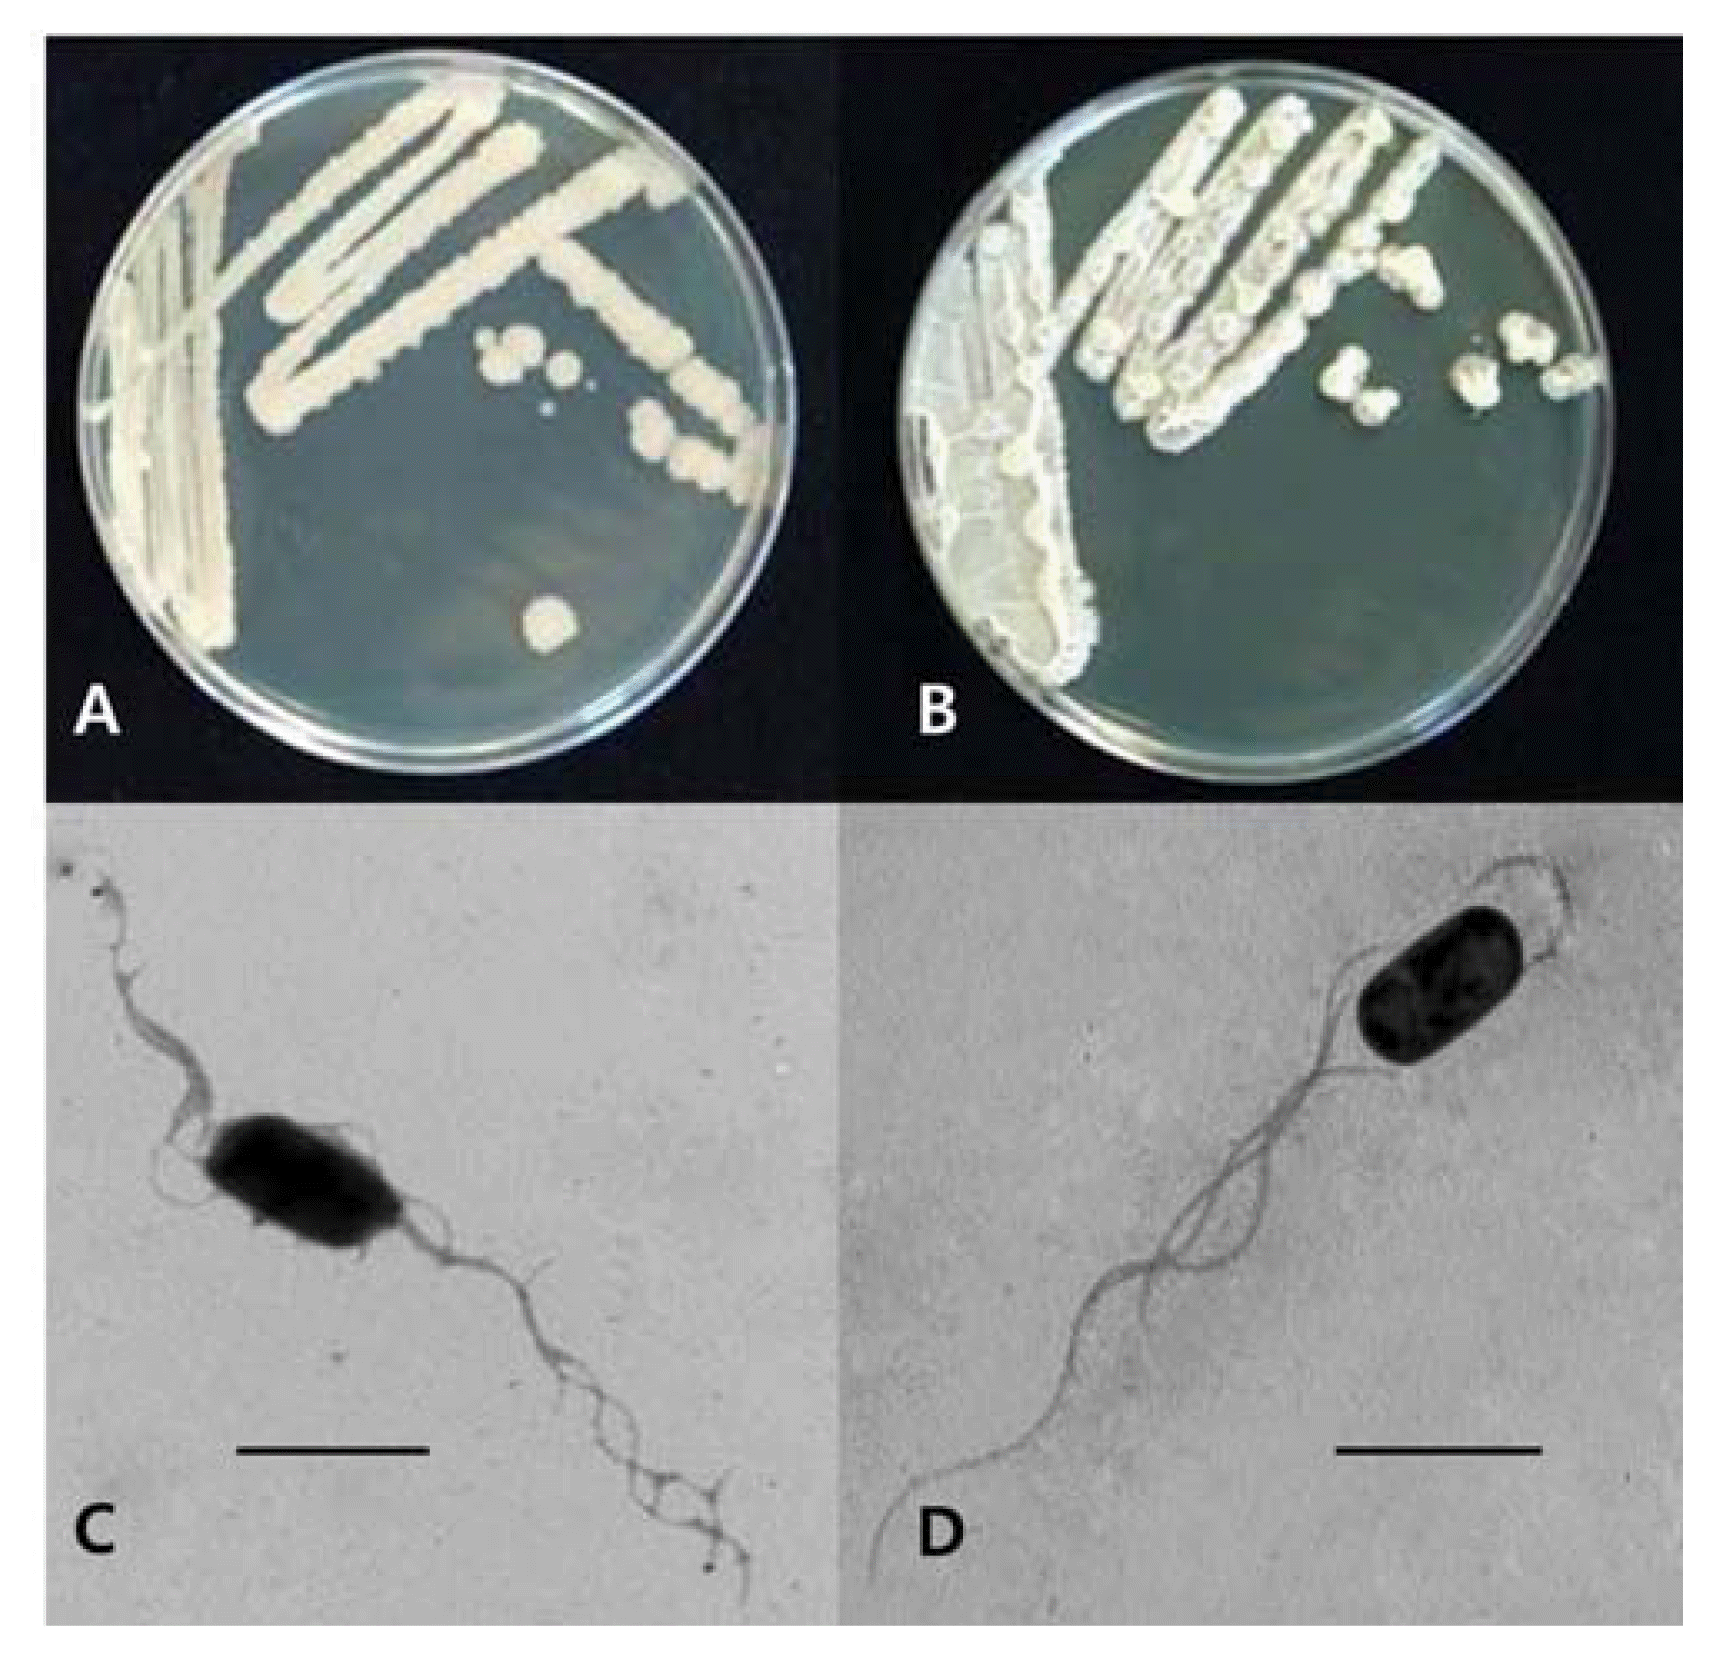
Fig. 1

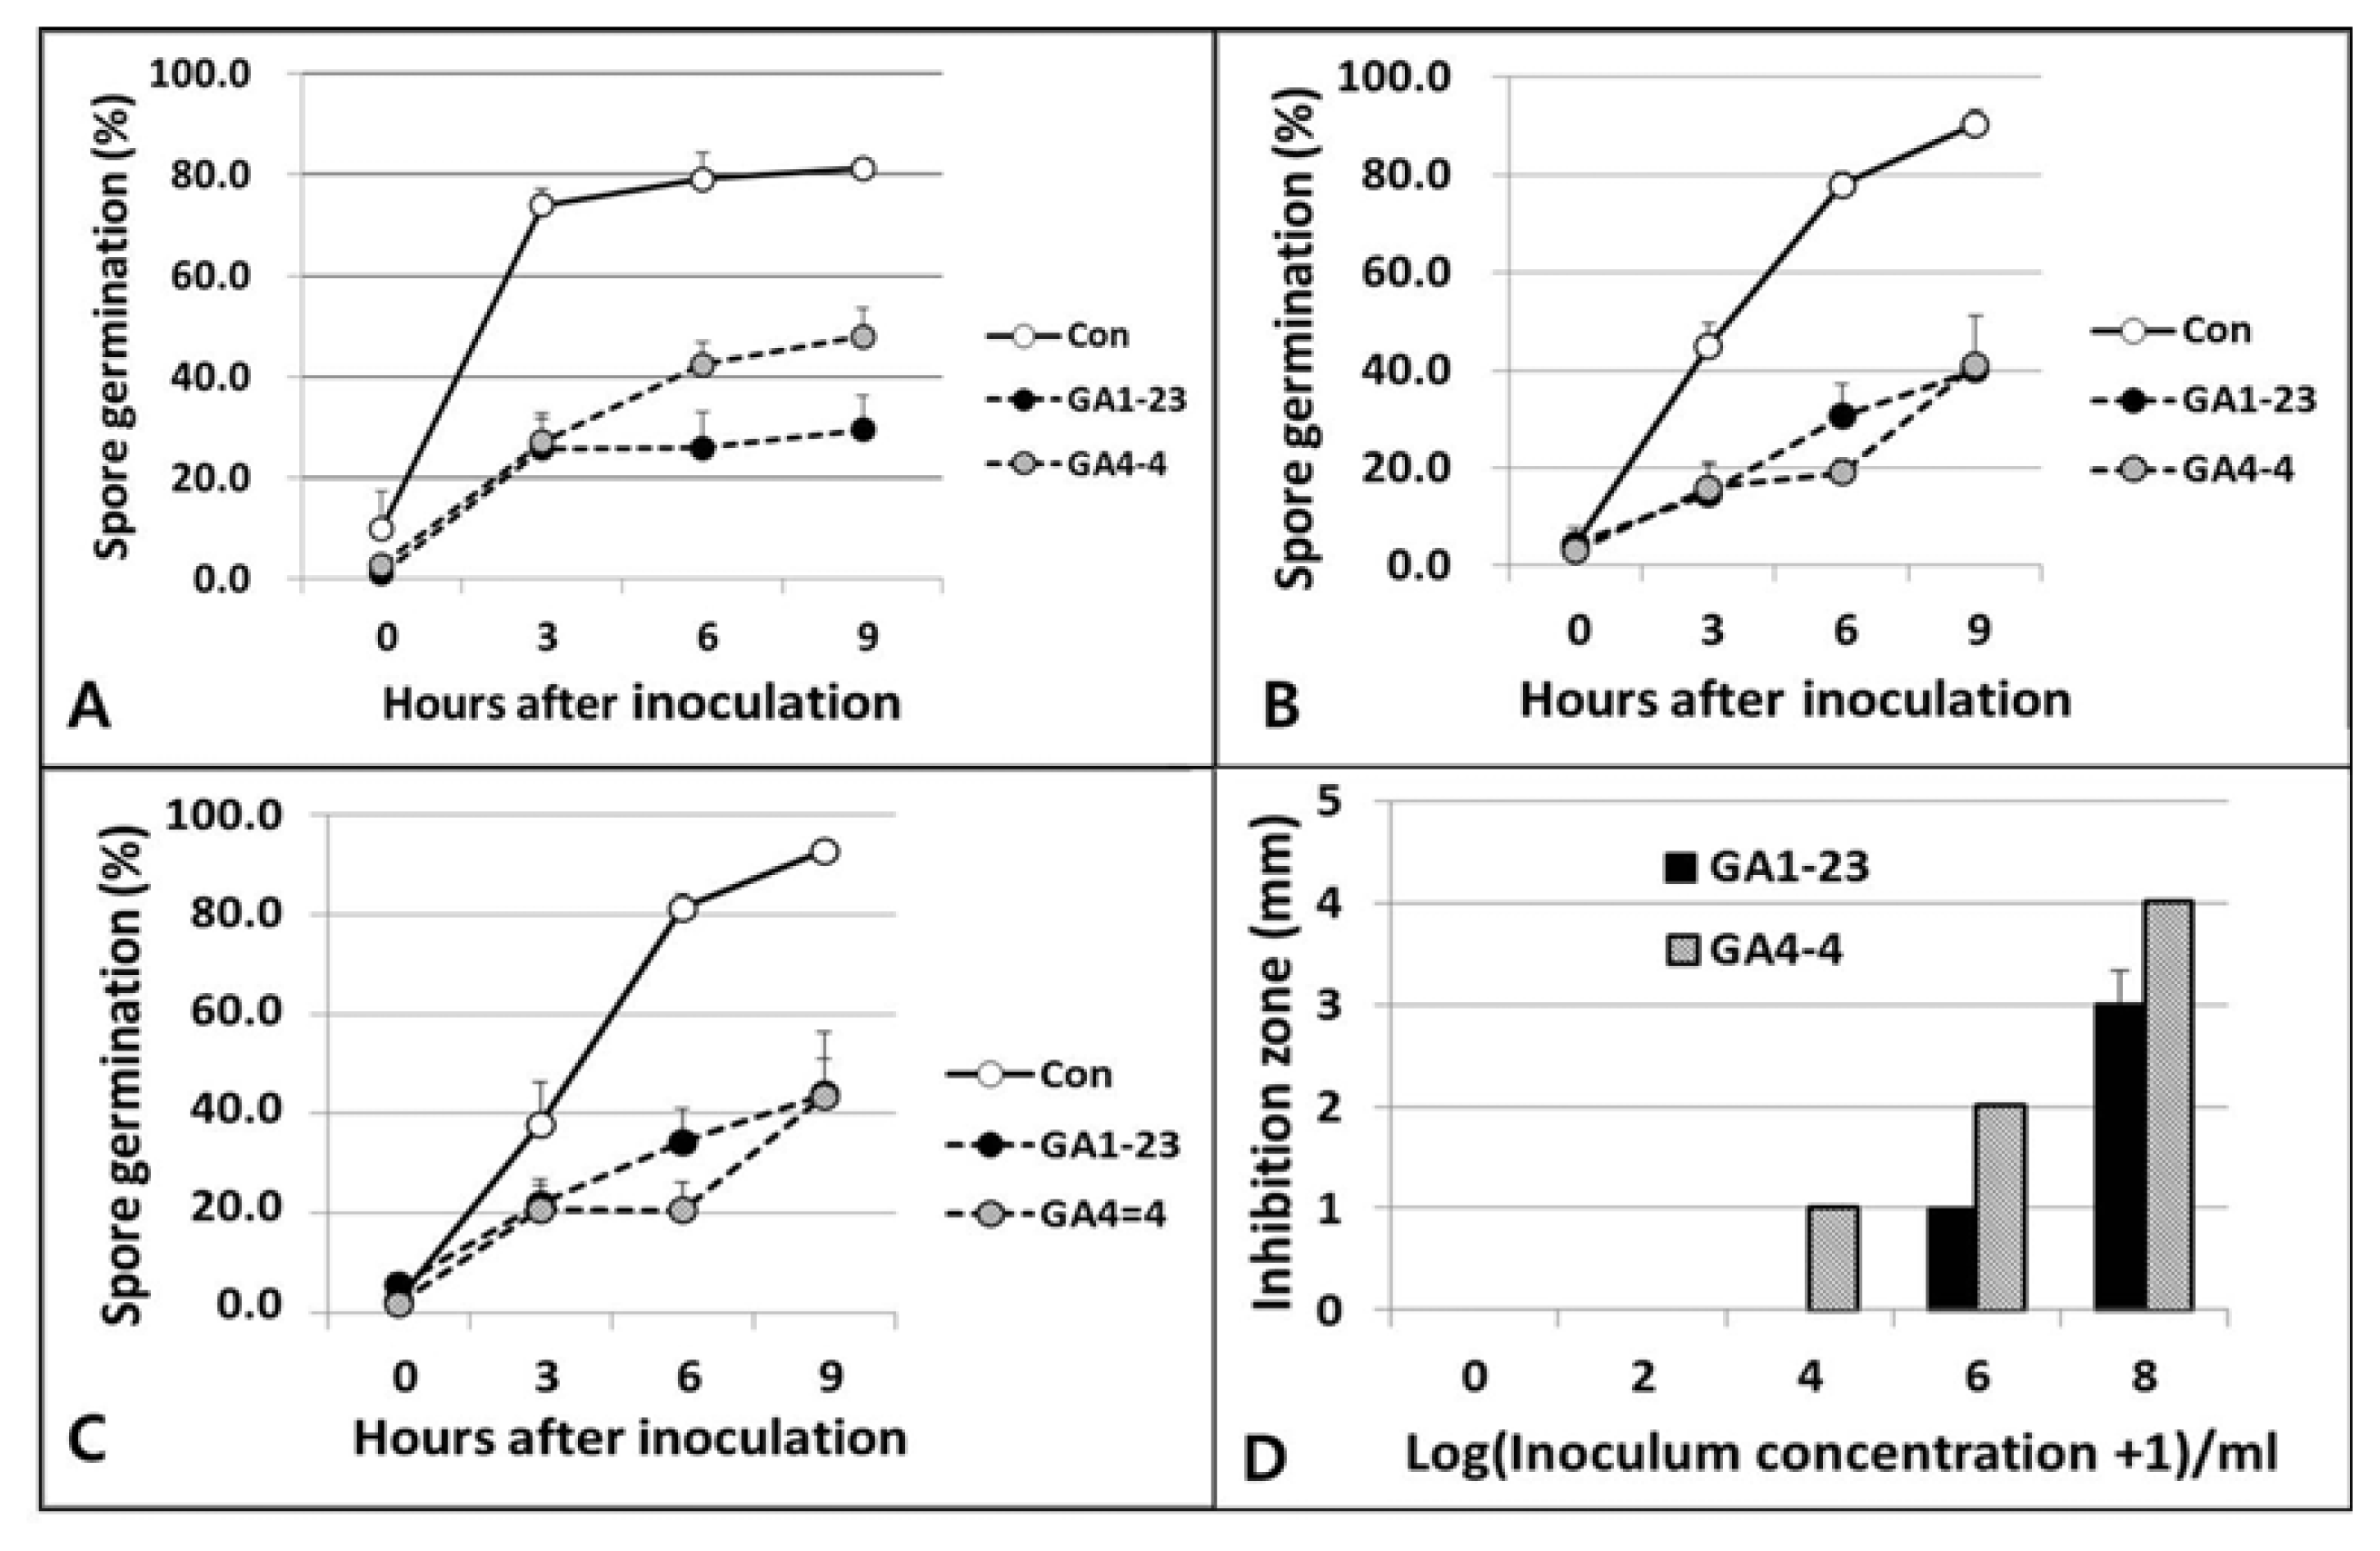
Fig. 2

Fig. 3

Fig. 4

Fig. 5

Table 1
| Treatment | Mycelial growth (mm) | Inhibition rate (%)a |
|---|---|---|
| Control | 29.3 ± 2.3Xb | - |
| GA1-23 | 9.8 ± 1.7Y | 66.6 |
| GA4-4 | 9.4 ± 1.6Y | 67.9 |
| WM7-12 | 10.3 ± 2.0Y | 64.8 |
| GA3-7 | 9.8 ± 1.1Y | 66.6 |
Table 2
| Temp. (°C) | Mycelial growth (mm) (Inhibition rate, %)a | ||
|---|---|---|---|
|
|
|||
| Treatments | |||
|
|
|||
| Control | GA1-23 | GA4-4 | |
| 18 | 23.3 ± 0.9(0.0)Wb(X)c | 10.2 ± 1.3(56.2)W(Y) | 8.6 ± 1.2(63.3)X(Z) |
| 21 | 26.7 ± 0.7(0.0)X(X) | 9.8 ± 1.5(63.5)X(Y) | 8.8 ± 1.0(67.2)XY(Y) |
| 25 | 39.6 ± 1.4(0.0)Y(X) | 10.2 ± 1.9(74.2)Z(Y) | 10.4 ± 1.6(73.6)Z(Y) |
| 28 | 30.8 ± 1.7(0.0)Z(X) | 9.7 ± 1.0(68.6)Y(Y) | 9.0 ± 1.6(70.8)YZ(Y) |
a Inhibition rate (%) = {(mycelial growth of control - mycelial growth of bacterial treatment at the same temperature)/mycelial growth of control} × 100
Table 3
| Nutrient conc. (%)a | Mycelial growth (mm) (Inhibition rate, %)b | ||
|---|---|---|---|
|
|
|||
| Treatments | |||
|
|
|||
| Control | GA1-23 | GA4-4 | |
| 0 | 23.2 ± 0.8(0.0)Wc(X)d | 13.0 ± 1.7(43.9)X(Y) | 10.5 ± 1.4(54.7)X(Z) |
| 25 | 25.8 ± 2.8(0.0)X(X) | 11.5 ± 2.7(55.5)Y(Y) | 11.3 ± 0.8(56.1)X(Y) |
| 50 | 35.0 ± 0.6(0.0)Y(X) | 11.3 ± 1.0(67.6)Z(Y) | 10.2 ± 1.7(71.1)Y(Y) |
| 75 | 39.5 ± 1.4(0.0)Z(X) | 11.0 ± 1.7(72.2)Z(Y) | 10.3 ± 1.5(73.8)Y(Y) |
| 100 | 40.3 ± 1.2(0.0)Z(X) | 11.7 ± 1.5(71.1)Z(Y) | 10.0 ± 2.0(75.2)Y(Y) |
a Nutrient concentration (%): concentration of potato-dextrose broth in water agar relative to the standard concentration of PD broth (26.5 gL−1)
b Inhibition rate (%) = {(mycelial growth of control - mycelial growth of bacterial treatment at the same nutrient concentration)/mycelial growth of control} × 100
Table 4
| Medium | Mycelial growth (mm) (Inhibition rate, %)a | ||
|---|---|---|---|
|
|
|||
| Treatments | |||
|
|
|||
| Control | GA1-23 | GA4-4 | |
| PDA | 32.3 ± 1.7(0.0)Wb(X)c | 7.4 ± 1.7(77.0)W(Y) | 7.4 ± 1.1(77.0)X(Y) |
| NA | 19.6 ± 2.4(0.0)Z(X) | 6.2 ± 2.7(68.2)X(Y) | 6.1 ± 1.3(68.8)Y(Y) |
| BHIA | 28.6 ± 1.2(0.0)X(X) | 8.1 ± 1.0(71.6)WX(Y) | 7.8 ± 1.0(72.8)XY(Y) |
| LBA | 18.2 ± 1.3(0.0)Z(X) | 9.3 ± 1.7(48.62)Z(Y) | 7.0 ± 0.6(61.5)Z(Y) |
| KBA | 30.3 ± 1.4(0.0)WX(X) | 7.3 ± 1.5(75.8)W(Y) | 7.0 ± 1.3(76.9)X(Y) |
| TSA | 25.3 ± 4.5(0.0)Y(X) | 9.8 ± 1.5(61.4)Y(Y) | 7.7 ± 1.5(69.7)Y(Y) |
a Inhibition rate (%) = {(mycelial growth of control - mycelial growth of bacterial treatment at the same nutrient concentration)/mycelial growth of control} × 100
Table 5
| Treatments | Disease severity indexa (Control efficacy, %)b | |||
|---|---|---|---|---|
|
|
||||
| Application time relative to pathogen inoculation | ||||
|
|
||||
| No inoculation | Pretreatment (Before inoculation) | Simultaneous treatment | Post-treatment (After inoculation) | |
| BHI (Control) | 0.0 ± 0.0(100.0)Xc(X)d | 2.0 ± 0.0(0.0)X(Y) | 2.8 ± 0.8(0.0)X(Y) | 3.2 ± 1.6(0.0)X(Y) |
| Difenoconazole | 0.0 ± 0.0(100.0)X(X) | 0.2 ± 0.5(90.0)Y(X) | 0.0 ± 0.0(100.0)Z(X) | 2.6 ± 1.5(18.8)X(Y) |
| GA1-23 | 0.0 ± 0.0(100.0)X(X) | 2.4 ± 1.7(−20.0)X(Z) | 1.0 ± 0.0(64.3)Y(XY) | 2.8 ± 1.3(12.5)X(YZ) |
| GA4-4 | 0.0 ± 0.0(100.0)X(X) | 2.2 ± 0.8(−10.0)X(Y) | 1.0 ± 1.0(64.3)Y(X) | 3.8 ± 1.6(−18.8)X(Y) |
a Disease severity index followed a six-scaling degree of 0 = no, 1 = initial small spot, 2 = ≤ 30% rotten, 3 = ≤ 60% rotten, 4 = ≤ 90% rotten, and 5 = 100% (whole scion and stock) rotten symptoms (Choi et al., 2010).
b Control efficacy (%) = {(Disease severity index of control - disease severity of treatment)/disease severity index of control at the same application time} × 100
References
- TOOLS
-
METRICS

- Related articles
-
Bipolaris Stem Rot of Cactus Cused by Bipolaris cactivora (Petrak) Alcorn1998 December;14(6)


 PDF Links
 PubReader
 Full text via DOI
 Full text via PMC
 Download Citation
 Print
Print


