Sampling and Selection Factors that Enhance the Diversity of Microbial Collections: Application to Biopesticide Development
Article information
Abstract
Diverse bacteria are known to colonize plants. However, only a small fraction of that diversity has been evaluated for their biopesticide potential. To date, the criteria for sampling and selection in such bioprospecting endeavors have not been systematically evaluated in terms of the relative amount of diversity they provide for analysis. The present study aimed to enhance the success of bio-prospecting efforts by increasing the diversity while removing the genotypic redundancy often present in large collections of bacteria. We developed a multivariate sampling and marker-based selection strategy that significantly increase the diversity of bacteria recovered from plants. In doing so, we quantified the effects of varying sampling intensity, media composition, incubation conditions, plant species, and soil source on the diversity of recovered isolates. Subsequent sequencing and high-throughput phenotypic analyses of a small fraction of the collected isolates revealed that this approach led to the recovery of over a dozen rare and, to date, poorly characterized genera of plant-associated bacteria with significant biopesticide activities. Overall, the sampling and selection approach described led to an approximately 5-fold improvement in efficiency and the recovery of several novel strains of bacteria with significant biopesticide potential.
Biopesticides constitute a rapidly growing subset of agricultural biotech inputs because of their proven efficacy, return on investment for producers, and reduced risk to consumers and the environment. And while the organic and sustainable food markets have been a clear driver in the increased use of biopesticides to date, the discovery of novel active ingredients will be one key to further market expansion (Marrone, 2007) especially for commercialization models based on patent protection (Harman et al., 2010). Some plant-associated bacteria can suppress plant pathogens and promote plant health through the expression of various mechanisms (Kim et al., 2011). Because these mechanisms require contact and growth on plant surfaces, bioprospecting efforts aimed at developing microbial bio-pesticides have focused largely on screening microbial collections acquired from agricultural soils and plants.
Both soils and plants are known to be extremely rich reservoirs of microbial diversity, with estimates of the total diversity ranging from tens of thousands to over a million species world-wide though the exact number is practically impossible to calculate (Sloan et al., 2008). Despite this, just over one hundred species of microorganisms have been developed into microbial biopesticides, approximately one third of which are bacteria (Copping, 2004). And, of these, only about two dozen species representing just ten genera (Agrobacterium, Azospirillum, Bacillus, Brevibacillus, Burkholderia, Erwinia/Pantoea, Pasteuria, Pseudomonas, Streptomyces) have been commercialized as microbial biopesticides for the control of plant diseases. Several more genera (Chromobacterium, Chryseobacterium, Klebsiella, Lysobacter, Mitsuaria, Paenibacillus) contain strains that are currently under development as microbial inoculants. More bacterial genera have been anecdotally reported to be associated with plants, but their potential to affect plant health remains largely uncharacterized. And, while isolates of a dozen other genera have been reported to display biological disease control or plant-growth promoting abilities (Rodriguez-Dias et al., 2008), most of these are still poorly characterized with relatively few strains assayed for biopesticide potential. Thus, there remains a great opportunity to characterize and develop novel plant-associated bacteria as biopesticide agents. The question is how, given limited resources, might one most efficiently access that diversity and focus R&D efforts on new and different agents?
The traditional approach to developing microbial inoculants for plant health disease suppression has been to first isolate large collections of microorganisms then systematically screen them for activity; first using simple and cheap assays, then more complicated and expensive bioassays to identify those isolates with the greatest activity (Fravel, 2005). More recently, molecular techniques have provided a glimpse of a much richer diversity of plant-associated microbial communities (Fierer et al., 2006; Yang et al., 2001). While much of this diversity remains uncultured in the laboratory, accessing novel phylogenetic groups through simple modifications of standard culture methods can be readily achieved (Nunes de Rocha et al., 2009; Qin et al., 2009). Molecular techniques have been combined with the culture-based techniques to identify and recover of novel species and subspecies of microorganisms with biopesticide activities (Borneman and Becker, 2007; Benitez and McSpadden Gardener, 2009). And while this newer approach to “identify then isolate” novel microorganisms with biopesticide potential is now being implemented with success in several laboratories, it is heavily dependent on sophisticated technical and statistical analyses of microbial community structure. Because of this, we reconsidered how the more traditional approach of “isolate then identify” might be systematically refined to increase the success rate of discovering truly novel microbial agents with biopesticide potential.
Materials and Methods
Media and storage conditions
Isolates were cultivated on solid and liquid media of four different recipes in this study. 1/3 × King’s Media B medium (KB) consisted of proteose peptone 6.7 g (Bacto, USA) monopotassium phosphate 0.4 g (Sigma Life Sciences Inc., USA), magnesium sulfate heptahydrate (Sigma life science Inc.) and 3.3 ml of glycerol (Junsei chemical Inc., Japan) per liter. 1/10 × tryptic soya medium (TS) was made with 3 g of Tryptic soil broth (Difco, USA) per liter. R2 medium consisted of proteose peptone 0.5 g (Bacto, USA) casamino acids 0.5 g (Difco, USA), yeast extract 0.5 g (Duchefa Inc., The Netherlands), glucose 0.5 g (Junsei Chemical Inc., Japan), soluble starch 0.5 g (Yoneyama Chemical Inc., Japan), dipotassium phosphate 0.3 g (Junsei Chemical Inc., Japan), magnesium sulfate heptahydrate 0.05 g (Duchefa Inc., The Netherlands), sodium pyruvate 0.3 g (Sigma Life Sciences Inc., USA), per liter, with a final pH of 7.2. L medium (LM) included peptone 5 g (Becton Dickinson Inc., USA), magnesium sulfate heptahydrate 0.2 g (Duchefa Inc., The Netherlands), ammonium iron(III) citrate 0.15 g (Daejung Chemical Inc., Korea), calcium chloride 0.05 g (Sigma Life Sciences Inc., USA), anhydrous ferric chloride 0.01 g (Aldrich Chemical Inc., USA), manganese sulfate monohydrate 0.01 g (Sigma life science Inc., USA) per liter. For soild medium, 1.5% agarose (Duchefa Inc., The Netherlands) was added prior to autoclaving. Strains were stored at −80°C on 1/10 TS with 17.5% glycerol added.
Sampling regimes and isolation methods
For the 1st collection, representing a mixture of 24 samples from 16 different species, approximately 1 g of material was recovered from either the roots or leaves of plants grown on the research farm, arboretum, or landscape of the Chonnam National University campus on Oct 6, 2009. Individual plant samples were classified to genus, and, where possible species. Samples were placed in 10 ml of sterile water and incubated overnight at room temperature. Samples were then vortexed, and, for subcollection 1A plated directly onto 1/10× Tryptic Soya Agar (TSA) or 1/3× King’s Media B Agar (KBA) or inoculated into liquid media of the same composition. For subcollection 1B, the washes were serially diluted 3.5 times × 6 dilutions in distilled water and either plated directly onto TSA or KBA or inoculated into liquid media of the same composition. After 24 hrs, 20 microliters of the liquid cultures were plated from each dilution onto the corresponding solid media. After 2 days of incubation on solid media, individual colonies were picked and stored for further analysis.
For the 2nd collection, representing the phyllosphere, individual leaves were sampled from the landscape around Agriculture Building IV on the campus of Chonnam National University (Gwangju, Korea) on Oct 10, 2009. Individual samples from different plants that were readily classified to genus. Individual leaves were pressed both onto 1/10 × Tryptic Soya Agar (TSA; top) and 1/3 × King’s Media B Agar (KBA; bottom). They were then dropped into a 50 ml tube containing 15 ml of sterile water, briefly vortexed and left to incubate at room temperature in the dark. After 12 hr and 120 hr, the tubes were vortexed for 60 sec, and 20 microliters of each wash were plated onto TSA or KBA and incubated for 2 days prior to colony picking.
For the 3rd collection, representing the rhizosphere, soils were collected from around Korea between November 16 and December 14, 2009. With the exception of sample 1 which was from a rice field, all other soils were taken from vinyl houses where various vegetables had been grown and harvested approximately one month prior to sampling. Approximately 3 kg of soil from the top 20 cm was mixed in situ at each location prior to being bagged and shipped to Gwangju. Soils were stored at room temperature in the dark prior to analyses. Soil chemical analyses were conducted by Jeonnam Agricultural Research and Extension Services (Naju, Korea) in December 2009. Tomato (Lycopersicon esculentum) and wheat (Triticum aestivum) were planted in small pots prefilled with 200 ml of each soil and grown in a greenhouse under standard growing conditions. Plants were harvested four and five weeks after planting. Roots were carefully removed and weighed, with 2 g (fresh weight) then being placed in 10 ml of sterile distilled water in 50 ml tubes for washing. These roots were vortexed for 60 sec to dislodge adhering bacteria, and 20 microliters was plated onto 1/3 × KBA, LMA, R2A, and 1/10 × TSA. In all cases, plates were incubated at room temperature for 2 days, following which individual colonies were picked and inoculated into 200 microliters of the same media in 96-well plates. After 24 hrs of incubation, 100 microliters of each culture was mixed into an equal volume of 35% glycerol and stored at −80°C. The remaining culture was frozen at −20°C prior to use as whole cell template for genotyping.
Genotyping isolate using amplified rDNA restriction analyses (ARDRA)
Individual isolates were recovered from glycerol stocks and plated onto the same media. After 2 to 4 days of growth, individual colonies were picked and used as whole cell templates for PCR amplification of the 16S rRNA gene using the eubacterial primers 8F and 1492R as described previously (Benitez and McSpadden Gardener, 2009). Briefly, master mixes contained 1 × PCR buffer 1.7 mM MgCl2, 0.2 mM dNTP, 2 pmol of each primer, 0.04 mg RNAse A, and 0.06 U GoTaq Flexi. Into 20 microliter aliquots the master mix, individual colonies were added and reactions incubated at 95°C for 5 min. Reactions were cycled 28 times at 94°C for 1 min, 54°C for 1 min, and 70°C for 2 min, with a final extension at 70°C for 8 min Restriction analysis was performed on 6.5 microliters of amplified products from each PCR reaction diluted with sterile water to a total volume of 16.5 microliters. To this, 10 U of MspI was added and products were digested for 2 hr at 37°C. Eight microliters of digested products were loaded onto 1.7% agarose gels in 0.5 × TBE and separated using electrophoresis. DNA bands were stained with ethidium bromide and visualized on a UV light box. Image capture relied on a GelLogic112 system, with images being exported to PowerPoint (Microsoft Inc., USA) for labeling. Sizes of individual bands were estimated using 100 bp ladder that was added to adjoining lanes, and sizing is accurate to ± 20 bp. Genotypes were scored individually by two different people and reconciled by consensus with a third. All primers, 100 bp ladder, agarose, and TBE were purchased from Bioneer Inc. (Korea); restriction enzymes were obtained from Fermantas Inc., (USA); and all other molecular biology supplies were obtained from Promega Company (USA).
High-throughput bioassay for biocontrol activity
One-day protective activities of the fermentation broths were evaluated against the six plant pathogens: Magnaporthe oryzae and Rhizoctonia solani on rice plants, Botrytis cinerea and Phytophthora infestans on tomato plants, Puccinia recondita on wheat plants, and Colletotrichum coccodes on red pepper plants. The in vivo antifungal bioassays were conducted as previously described (Cho et al., 2000; Kim et al., 2001). Briefly, plants were grown in vinyl pots (4.5 cm diameter) for 1 to 4 weeks. The 3-day old fermentation broths of the test isolates were diluted three-fold with distilled water and then Tween-20 was added to a concentration of 250 mg/l. Serenade, a microbial biopesticide produced by Agraquest (Davis, CA), was diluted to the 1X application rate according to the manufacturer’s instructions and then applied as a positive control. Untreated control plants were treated with a Tween-20 solution alone. Plant seedlings were sprayed until run-off with each of the solutions. After 24 hr, the treated plant seedlings were inoculated with spores or mycelial suspensions of one of the six plant pathogens. Disease symptoms were rated from 3 to 7 days after inoculation, depending on the pathogen. The pots were arranged in a randomized complete-block design, with two replicates per treatment. The 24 isolates displaying the greatest biopesticide potential were retested and the four estimates for each treatment converted into a control percentage compared with the control treatments by the equation: % control = 100[(A – B)/A, where A = the area of infection (%) on leaves or sheaths sprayed with a Tween-20 solution alone and B = the area of infection (%) on treated leaves or sheaths.
Induced systemic resistance bioassay
Pepper (Capsicum annuum) seeds were sown in a tray including autoclaved nursery soil. The tray was placed in a greenhouse maintained at 25°C during the daytime. After 10 days, young pepper plants were transplanted into pots (9 cm × 8 cm) which contained autoclaved nursery soil and vermiculite 5:1 (v:v). The bacteria used in these assays were recovered from glycerols and incubated on TSA at room temperature for 48 hr prior to inocula preparation. Pure colonies were of the test isolates were resuspended in sterile water and cell density adjusted to ~3 × 10⁸ CFU/ml based on optical density at 600 nm prior to inoculation (see below). Inocula of Xanthomonas campestris pv. vesicatoria consisted of cells resuspended in 0.85% NaCl + 0.02 % Silwet L-77 (Lehle Seeds, USA). When the plants reached the 3 to 4 leaf stage, 5ml of the selected isolates (~3 × 10⁸ CFU/ml) were drenched onto each root system. Five days later, leaves were spray inoculated with 2 ml of X. campestris pv. vesicatoria (~1 × 10⁸ CFU/ml). The pathogen treated plants were placed in a growth chamber (dark, 25°C, 100% relative humidity) for 24 hr and replaced in greenhouse. Five days later, disease ratings for each of the upper four leaves, excluding newly emerged leaves were made, and the average disease rating per plant used for analysis. Three plants per treatment were evaluated relative to a negative control. Disease reduction was calculated as percent control = 100[(A – B)/A, where A = the disease rating of the negative control and B = the disease rating of the root drenched plants from each treatment.
Statistical analysis
Data were organized and sorted in Excel 2007 (Microsoft, Inc., USA). Statistical tests were performed using Minitab v. 15.1.3 (Minitab Inc., USA). Evaluation of frequency data was performed using the Tally Individual Variables and Chi-squared Goodness of Fit functions where individual sample sizes for each varied depending on the variable tested, with n > 44 for all classes. Evaluation of bioassay data (n = 3 or 4 for all tests) was performed using General Linear Models with comparisons to the controls being performed using Dunnet’s test. The obtained P-values are noted in the text.
Results
General description and genotyping of bacterial collections
In order to determine which sampling variables might provide access to the greatest spectrum of bacterial diversity and novelty, we developed and analyzed three different bacterial strain collections. Collection 1 (mixed collection) consisted of 1032 isolates obtained from 24 plant samples (representing leaves and/or roots of 16 different plant species) grown on liquid or solid states of two different media. This collection was asymmetrically divided to assess the effects of different selection intensities (i.e. the number of colony picks per sample) and reproducibility of different independent samples coming from the same or different plant species. Collection 2 (phyllosphere collection) consisted of a total of 1080 isolates obtained from individual leaves of 12 different plant species, incubated 3 different ways, and plated onto 2 different media. Collection 3 (rhizosphere collection) consisted of a total of 1120 isolates obtained from rhizosphere of 2 different plant species, planted in 10 different soils, and plated onto 4 different media.
The genotypic diversity of each collection was assessed by amplified ribosomal DNA restriction analysis (ARDRA) using MspI and the occurrence of different banding patterns was noted. In this way, we identified 62, 88 and 132 distinct genotypes in Collection 1 (N = 1032 isolates), Collection 2 (N = 691 isolates) and Collection 3 (N = 657 isolates). Across all 3 collections, a total of 237 distinct genotypes were noted, indicating that there was substantial collection to collection variation. Additional genotypes may be present in these collections, as nearly 40% of initial isolates were determined to be mixed cultures, based on the number and collective size of bands revealed by ARDRA. However, most of these colony picks displayed banding patterns consistent with at least one or more previously identified genotypes. Therefore, we made the strategic decision to increase throughput and not further purify those additional colony picks.
Effects of sampling design on the distribution of common and rare genotypes in the different collections
The genotypic structures of the each of the collections were analyzed to assess the overall effect of using different combinations of sampling and selection factors (Table 1). Overall, we observed that collection designs with more independent samples (initial factor) and fewer isolate per sample (last factor in design) were the most diverse. This was shown by the fact that Collections 1B, 2, and 3 yielded 2 to 3 times as many genotypes per 100 isolates. Those same collections also had much more even distribution of genotypes, with the greatest balance occurring in Collections 2 and 3 where the five most common genotypes represented < 50% of the collection.
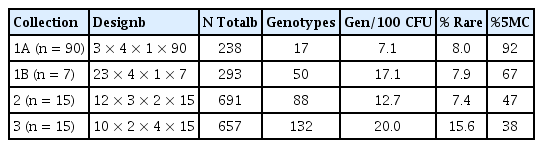
Histograms of the data revealed that all collections were skewed in their distribution of genotypes, though the degree of skew varied by sampling regime, selection intensity, and environment. In mixed collection (Collection 1), the sub-collection defined by a relatively deep selection criteria of n = 90 per sample per media, had just 17 genotypes, with the 5 most commonly recovered genotypes (27, 26, 51, 4 and 52) represented 88% of the isolates (Fig. 1). This was the most skewed collection as just three genotypes (27, 26, and 51). In contrast, a much wider sampling (23 samples, n = 7 per sample per media) was more diverse, with the 5 most commonly recovered ARDRA-defined genotypes (20, 26, 44, 45 and 50) representing only 67% of the isolates (Fig. 1B). Using a sample size of 15 isolates per media per sample gave even more diverse collections (Table 1). In the phyllosphere (Collection 2), 47% of the isolates belonged to just 5 commonly recovered ARDRA-defined genotypes (37, 61, 59, 71 and 50). In the rhizosphere collection (Collection 3), the 5 most common genotypes (75, 60, 77, 124, and 122) accounted for only 38% of the 657 cleanly genotyped isolates. In both cases where n = 15 per sample per media, the single most commonly recovered genotypes (numbered 37 and 70, respectively) constituted just about 15% of each collection. Each collection also had a good number of rare genotypes, defined as those patterns observed to occur just once or twice (i.e. < 0.5% of the total). For comparable sampling and selection regimes, the rhizosphere provided nearly twice as many rare genotypes (45 singlets and 58 doublets) than the phyllosphere (31 singlets and 20 doublets). This was due to the fact that there was relatively little commonality of the genotypes recovered from different samples or media. Overall, these data indicate that relatively balanced multifactor sampling and selection designs can provide substantially more diverse collections than those using more unbalanced designs.
Distribution of unique genotypes in Collection 1. Genotypes were determined using MspI digestion of amplified ribosomal DNA amplified from each isolate. The y-axis represents the number of times each genotype was observed in Collection 1A (2 samples, n = 90 for each) or 1B (23 samples, n = 7 for each).
Determination of appropriate selection intensity per sample
With Collection 1, we set out to specifically determine an appropriate selection intensity (i.e. number of colony picks per sample) that would lead to an optimal recovery of diverse genotypes with clear capacity to colonize plant tissues. Previous reports have indicated skewed distributions of bacterial counts on both above and below ground plant parts, and it is well established that bacteria aggregate in biofilms of various sizes on plant tissues. We found that the mean number of genotypes per sample (across all tested media) was 2.2, 4.1, 5.7, and 6.3 for n = 7, 14, 21, and 90, respectively. And, the total number of genotypes ranged from 1–6, 2–9, 3–10, and 5–8 per media over the same four sampling intensities, with the only significant difference being the lower number of genotypes for n = 7, as compared to the other sample sizes. These data indicate that an optimal number of distinct isolates is recovered with just 14 and 21 colony picks per sample. Beyond that sampling intensity, the recovery of new genotypes is very rare. Such a selection intensity is further indicated by the observation that there was very little overlap in the genotypes detected between samples on the same media, or between media for the same samples with n = 7. And similar observations were made with n = 15 in Collections 2 and 3 (see below). Nonetheless, the discovery of new genotypes followed a pattern of diminishing returns with increasing the number of samples. Specifically, the average number of genotypes per sample ranged from 1.4 to 2.7 on the different media, but the use of 23 samples only increased the number genotypes recovered by just 7- to 11-fold depending on the media used. From these data, we concluded that a rather shallow selection (e.g. n = 15 colony picks per sample) across a rather wide sample based (e.g. 10 to 12 different samples) provided the lowest degree of redundancy within our collection. These values were then used to develop and further assess the factors affecting the diversity recovered in Collection 2 (phyllosphere) and Collection 3 (rhizosphere).
Factors affecting the recovery of novel genotypes from the phyllosphere.
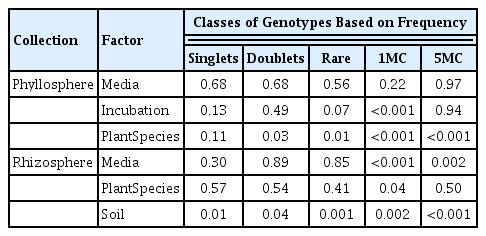
With Collection 2, we set out to determine whether media, sample incubation condition, or plant species had the greatest effect on the number of novel genotypes recovered from the phyllosphere. While different rare genotypes were recovered on the two media tested, the number of these did not vary significantly (P > 0.5). In contrast, the ex situ factor of incubation condition did have a marginal effect on the recovery of rare genotypes (P = 0.07), with the leaf press tending to provide more novel genotypes than the 12 hr and 120 hr incubations in water. These two additional incubation conditions were intended to model natural processes of extended precipitation and/or leaf deposition in puddles, natural conditions that are expected to lead to the recovery of previously uncultured genotypes. The recovery of rare genotypes from leaves was most strongly influenced by the in situ selection factor of plant species (P = 0.01; Table 2). For every 15 isolates, the number of genotypes isolated per plant species ranged from 1 to 9, averaging from 3.2 to 5.3 per media. Using our tiered sampling regime, most individual leaf samples provided 2 to 8 rare genotypes, with only the Magnolia sample providing no unique genotypes.
Factors affecting the recovery of novel genotypes from the rhizosphere
Having examined the phyllosphere of plants grown in a local area where colonizing bacteria are captured from a theoretically broad (i.e. airborne) pool of emigrating microbes, we next turned to examine the relative importance of various factors on the recovery of novel bacterial genotypes from root tissues which are typically exposed to large but relatively immobile pools of diversity. With Collection 3, we characterized the relative influence of media, plant species, and soil source on the diversity of recovered isolates.
In the rhizosphere, the choice of media, again, affected the type but not the number of rare genotypes recovered (Fig. 1). In contrast with the phyllosphere, the number of rare genotypes recovered from the rhizosphere did not vary by plant species (P > 0.4). In this study, the recovery of rare genotypes from the rhizosphere was most strongly influenced by soil source (P = 0.001, Table 2). Interestingly, no apparent correlation in the number or identity of genotypes was observed for the closely paired soils (3 and 4, 5 and 6, 7 and 8, and 9 and 10), which varied from < 5 to just under 250 m apart. This indicates that while substrate differences are important, they are perhaps not much more important than environmental differences in soil conditions occurring over relatively small spatial scales. For every 15 isolates, the number of genotypes per soil source ranged from 1 to 8, averaging just 2.4 to 3.9 genotypes per media depending on the crop. Using our tiered sampling regime, each soil provided between 6 and 15 rare genotypes, reflecting the greater number of media used to create this second collection. These data support the view that rhizosphere microbial communities, like those in the soils from which they are derived, are strongly influenced by the many complex and interacting factors that limit spread and enhance localized evolution of microbial populations (Garbeva et al., 2004). And these data highlight the benefit of sampling diverse matrices into which roots can productively grow to identify novel rhizosphere bacteria.
Screening of distinct genotypes for biocontrol activity
We next considered the question of whether or not the three collections might include novel biofungicidal or plant health promoting bacteria. In this study, we chose to screen 419 isolates in planta based primarily on genotypic differentiation. These included 176 mixed collection isolates representing 52 of the 62 identified genotypes, 129 phyllosphere isolates representing 80 of the 88 identified genotypes, and 82 rhizosphere isolates representing 67 of 132 genotypes. While not all genotypes were tested (due to limited resources), particular emphasis was placed on the rare genotypes because of our motivation to discover new biopesticide agents.
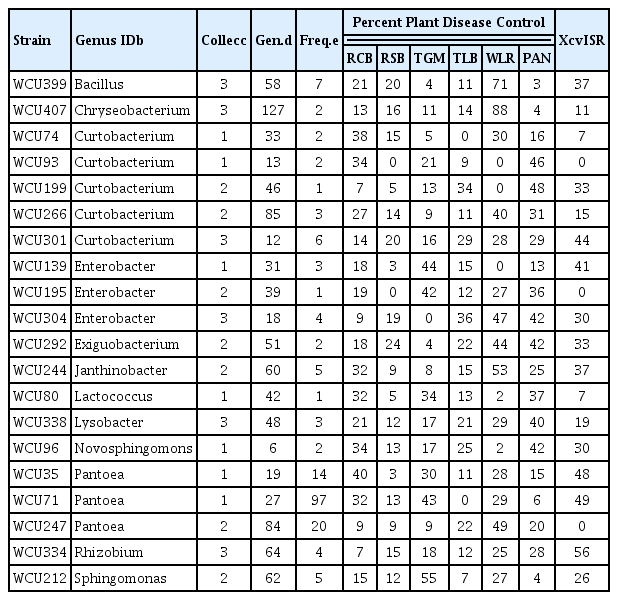
From this primary screen targeting 6 different plant diseases, 48 isolates displaying the greatest biopesticide potential were retested and also assayed for their ability to induce system resistance to disease caused by a phytobacterial pathogen. Of these, a diverse set of 20 isolates displayed remarkable biopesticide properties (Table 3). Putative identifications of these isolates were made using single-pass 16S rRNA gene sequencing (data not shown). Each of these 20 strains reduced disease relative to the negative control (P < 0.10) and did so as well or better than the commercial biofungicide Serenade (containing Bacillus subtilis strain QST713) for one or more pathosystems (bold values in Table 3). Additionally, 15 of these strains reduced the average disease severity rating of Xanthomonas campestris pv. vesicatoria infection on pepper; and such patterns were statistically significant (P < 0.10) for 9 of the isolates. Remarkably, 16 of these top performing isolates were rare in our collections, i.e. found to occur at a frequency of ≤ 1% of the selected isolates. For those five genotypes more commonly found in our collections, some significant variation in efficacy among isolates of the same genotypes was noted (data not shown), indicating that the ARDRA-genotype was not always predictive of biocontrol ability. Most of the selected genotypes were obtained from distinct combinations of sample variables, with all combinations of source, incubation, and media being represented. And, eight (38%) were classified as rare genotypes, i.e. singleton or doublets, in our collections.
Discussion
Here, we demonstrated that a balanced, multifactorial sampling regime, coupled with marker-assisted selection of isolates could result in the discovery new genotypes of active biocontrol bacteria. The results of this work have practical implications for the expansion of the biopesticide industry. Most remarkably, the 21 isolates we identified represented 12 different bacterial genera (Table 3), some of which have been only rarely if ever noted for their biocontrol activities (i.e. Curtobacterium, Exiguobacterium, Janthinobacterium, Lactococcus, Novosphingomonas, and Sphingomonas). To date there have been no commercial products developed containing isolates from these genera. And, while microbial inoculants of Rhizobium are widely used on legumes, none to our knowledge have been produced for the purpose of plant disease control. Because there are microbial products containing Bacillus, Chryseobacterium, Enterobacter, Lysobacter, and Pantoea strains as active ingredients either on the market or under development, the strains isolated in this study need to be compared to those others to determine whether or not they offer any extraordinary opportunities for commercial development.
Based on prior research with soil- and root-inhabiting Pseudomonas, we expected to observe a mix of endemic and cosmopolitan genotypes (Cho et al., 2000; McSpadden Gardener et al., 2005) because of the complex interactions between spatial distance and the incumbent environmental heterogeneity (Ramette and Tiedje, 2007). In this work, the five most common genotypes from the rhizosphere collection were observed to occur in most soils sampled from vegetable farms all over the Republic of Korea. However it is unclear if the rare genotypes are endemic to specific locations or simply less frequently dominant. While a large number of ex situ selection factors have been proposed to increase the recovery of previously uncultured bacteria from the rhizosphere (Zengler, 2009), we decided to focus on media type and two key factors thought to most dramatically affect the relative abundance of rhizosphere bacteria in situ, i.e. plant species and soil source (Garbeva et al., 2004; Ibekwe et al., 2010). And, we made the strategic decision to restrict our search to agronomically relevant environments by using only soils obtained from geographically distinct farms. It is well known that soil quality, especially that of organic matter, is a primary determinant of general disease suppressiveness (Hoitink and Boehm, 1999), however we did not identify any association between the number of biocontrol genotypes recovered and any of the measured soil physical or chemical properties listed (data not shown). Nor did we find any such associations more generally across our rhizosphere collection. This may indicate that the differences in root chemistry presented by different plant species can be readily tolerated by the cultured bacteria in our collections, an observation that is consistent with another recent study of cultured rhizosphere bacteria (Sachs et al., 2009). While more intensive sampling may indicate the extent to which these plant-associated bacteria are distributed in different soils, our results from Collection 1 indicate that such investigations are not likely to be cost effective for bioprospectors because of the redundancy often observed in isolates obtained from single samples (Table 1).
The approach to bioprospecting for active strains might be different, though, when one considers our data on phyllosphere diversity. In this work we observed that 3 of the 12 plant species used for the phyllosphere collection contributed disproportionate numbers of rare genotypes. Therefore, it is possible that some other plant species may be found that yield more unique genotypes. While such diversity would likely be useful for identifying natural products useful for plant disease control (Copping and Duke, 2007), it is uncertain if microbial biopesticides based on such rare genotypes would be successfully applied to crop plants to which they are not well adapted. Additionally, season, a factor not studied here but likely reflects changes in host chemistry and prevailing abiotic conditions, might also affect recovered genotypes. Indeed, studies of airborne bacteria have shown that the structure of emigrating populations can vary substantial with season (Fahlgren et al., 2010). Because of these findings, we suggest that bioprospectors focus more energy on the recovery and characterization of bacteria from the phyllosphere of diverse plant species.
Previously, marker-assisted selection has been used for over a decade to recover novel subspecies of biocontrol bacteria based on the occurrence of antibiotic biosynthesis genes (McSpadden Gardener et al., 2000). And, phylogenetic markers have been used to identify and recover novel and active biocontrol bacteria when used in combination with microbial community profiling (Benitez and McSpadden Gardener, 2009). However, to our knowledge, this is the first report of using marker-assisted selection to improve the efficiency of traditional bioprospecting approaches to identify rare and novel strains. Here, the application of an ARDRA-based screen and our particular multifactor sampling and selection strategies were able to yield 4 to 6 times as many genotypes and 4 to 7 times as many effective isolates for biopesticide development as could be expected from a random screen of the same number of isolates. Because different genotypes were identified using different media and incubation conditions, it is reasonable to assume that even greater improvements in the efficiency of selection could be obtained, by simply using more types of selective media and non-overlapping incubation conditions. These data provide a clear indication that a marker-assisted, multi-factorial sampling and selection strategy can be used to improve the efficiency of bioprospecting efforts. Application of this approach could rapidly expand the diversity of active ingredients available for commercial development.

Distribution of unique genotypes in Collections 2 and 3. Genotypes were determined using MspI digestion of amplified ribosomal DNA amplified from each isolate. The y-axis represents the number of times each genotype was observed in Collection 2 (phyllosphere) or Collection 3 (rhizosphere).
Acknowledgements
We thank Dr. Kyung Seok Park of the RDA and Dr. Seon Woo Lee of Dong-A University for access to field sites in Suwon and Pusan, respectively. This work was supported by the World Class University project of the National Research Foundation of Korea (grant no. R32-20047).