Proteomic Reference Map and Comparative Analysis between Streptomyces griseus S4-7 and wbiE2 Transcription Factor-Mutant Strain
Article information
Abstract
Streptomyces griseus S4-7, a well-characterized keystone taxon among strawberry microbial communities, shows exceptional disease-preventing ability. The whole-genome sequence, functional genes, and bioactive secondary metabolites of the strain have been described in previous studies. However, proteomics studies of not only the S4-7 strain, but also the Streptomyces genus as a whole, remain limited to date. Therefore, in the present study, we created a proteomics reference map for S. griseus S4-7. Additionally, analysis of differentially expressed proteins was performed against a wblE2 mutant, which was deficient in spore chain development and did not express an antifungal activity-regulatory transcription factor. We believe that our data provide a foundation for further in-depth studies of functional keystone taxa of the phytobiome and elucidation of the mechanisms underlying plant-microbe interactions, es-pecially those involving the Streptomyces genus.
Suppressive soils are defined as “soils in which the pathogen does not establish or persist, establishes but causes little or no damage, or establishes and causes disease for a while but thereafter the disease is less important, although the pathogen may persist in the soil” (Weller, 2007). In contrast, the disease in question readily occurs and persists in non-suppressive soils (conducive soils). Currently, many different types of suppressive soils have been reported, including those with suppressiveness against Fusarium oxsporum, Streptomyces scabies, and Heterodera avenae (Weller et al., 2002). Fusarium wilt of strawberry is caused by F. oxysporum f. sp. Fragariae, which forms three types of spores: microconidia, macroconidia, and chlamydospores. Chlamydospores can persist in a dormant stage in the soil for as long as 30 years, and each of these spores can be spread through running water, farm implements, and machinery (Couteaudier and Alabouvette, 1990). Reliable chemical control of strawberry Fusarium wilt disease is unavailable to date. Streptomyces griseus S4-7 has been isolated from a strawberry field and characterized as the suppressive agent in Fusarium wilt in a previous study (Cha et al., 2016). Interestingly, the strain was detected in the strawberry flower as well as in the pollinator body (Kim et al., 2019a). Streptomyces griseus S4-7 is unnoted the most of basic information such as antibiotic biosynthesis pathway, regulatory mechanisms (Kim et al., 2019b). Previous proteomic studies of Streptomyces spp. focused on membrane proteome analysis and gene mapping for substance analysis. The wblE2 mutant, deficient in a whi-type transcription factor, failed to inhibit the growth of the fungal pathogen or confer plant protection (Cho et al., 2017). In the present study, we aimed to create a proteomic reference map of the S4-7 strain. Proteomic mapping of S4-7 should provide insights into S4-7 physiology and enable investigation of its potential for antibiotic biosynthesis and biocontrol applications.
Bacterial strains, S4-7 and wblE2 mutant, were cultured in 25 ml of YEME (yeast extract 3 g, malt extract 3 g, peptone 3 g, glucose 10 g, sucrose 170 g, and agar 20 g per liter). The cells were harvested by centrifugation and resuspended as 108 colony-forming units/ml. Then, 1 ml of the bacterial solution was inoculated onto nitrocellulose membranes coated with MS (mannitol soya flour agar: 20 g of mannitol, 20 g of soya flour, and 20 g of agar per 1 liter). The mycelium was scraped from the cellophane discs at three different time points during colony development for further observation: at 24 h, when only vegetative mycelium was observed; at 48 h, when aerial mycelium covered the plates; and at 72 h, when the color of the mycelium surface turned gray because of sporulation (Supplementary Fig. 1).
Proteins were extracted from the S4-7 and ΔwblE2 strains at three developmental time points (24, 48, and 72 h) using the trichloroacetic acid/acetone/phenol extraction method (Kwon et al., 2014). The extracted proteins were quantified using a 2D-Quant Kit (Amersham Biosciences, Bukinghamshire, UK). Soluble protein (300 µg) was used for two-dimensional gel electrophoresis (2-DE) analysis. For isoelectric focusing, PROTEAN IEF cell (Bio-Rad, Hercules, CA, USA) was used with immobilized pH gradient strips (17 cm, pH 4-7, Bio-Rad). Then, two-dimensional sodium dodecyl sulfate polyacrylamide gel electrophoresis was performed using the Protein Xi-II Cell System (Bio-Rad). The gels were stained with Colloidal Coomassie Blue G-250 (Candiano et al., 2004). Images were acquired using a GS-800 Imaging Densitometer (Bio-Rad). Abundant proteins were detected with PDQUEST (version 7.2.0, Bio-Rad). Spot densities were normalized to a relative density, and the mean values from triplicates were compared. The cut-off for differential expression was set at 1.5-fold change. To identify abundant proteins, the spots were excised and digested by in-gel tryptic digestion. The cleavage (peptide) solution was loaded onto a matrix-assisted laser desorption inonization-time of flight/mass spectrometry (MALDI-TOF/MS) sample plate and analyzed by an ABI 4800 Plus TOF-TOF mass spectrometer (Applied Biosystems, Foster City, CA, USA). MALDI-TOF MS spectra were queried using the National Center for Biotechnology Information (NCBI) protein database with ProteinPilot (version 3.0, AB Sciex, Framingham, MA, USA) and the MASCOT search engine (version 2.3.02, Matrix Science, London, UK). The statistical significance threshold was set at P < 0.05.
In S. griseus, a total of 435 protein spots were detected from the 2-DE gel (Fig. 1) and 223 proteins were identified and assigned functions (Supplementary Table 1). Functional distribution of the identified proteins was as follows: protein biosynthesis (16%), oxidoreductase activity (9%), transcription and regulation (9%), hydrolase activity (6%), protein folding (5%), transferase activity (5%), glucose metabolism process (5%), ATP synthesis (5%), amino acid biosynthesis, DNA damage and repair, response to stress, transport, ligase, tricarboxylic acid cycle and inositol biosynthesis process (2% each), hypothetical protein (11%), and uncharacterized protein (11%) (Fig. 2). The data indicated that the strain used energy sources mainly for primary metabolism, and that the strain required large amounts of amino acids and related metabolic processes for development and growth under laboratory culture conditions.
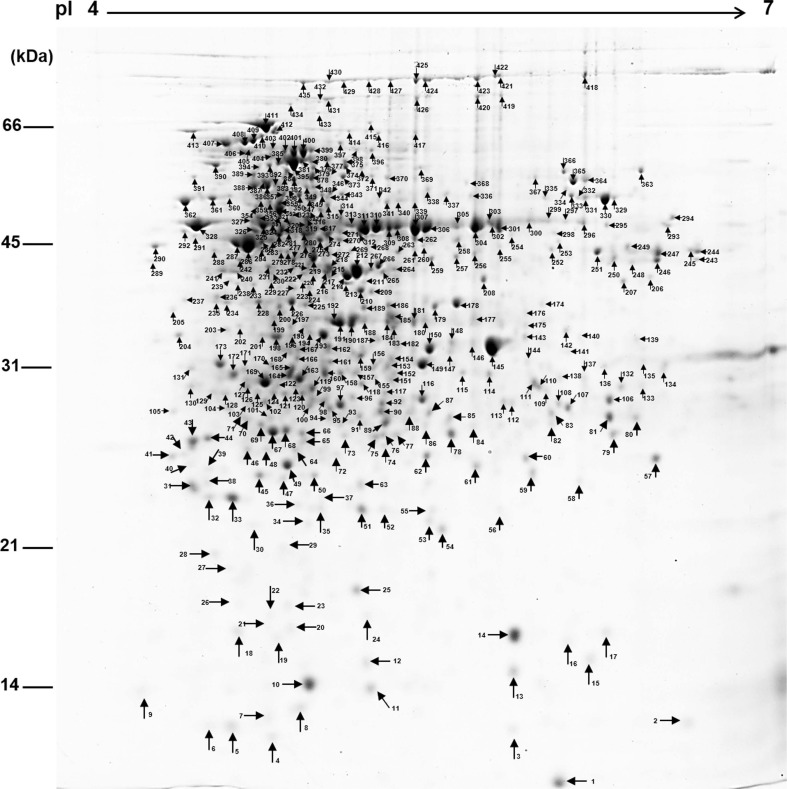
Protein expression profile of Streptomyces griseus S4-7. Proteins loaded onto 17 cm isoelectric focusing strips, pH 4 to 7 linear gradient. The strip was placed on top of 12.5% polyacrylamide gels for sodium dodecyl sulfate polyacrylamide gel electrophoresis. The gel was stained with Coomassie Brilliant Blue R-250.
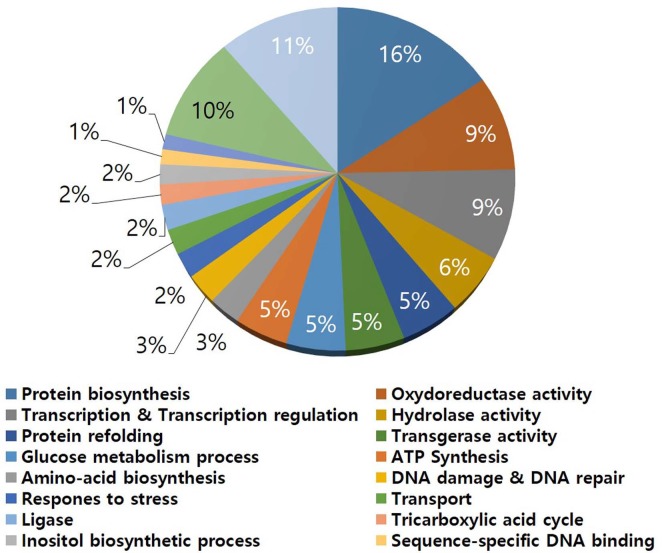
Functional classification of identified proteins in Streptomyces griseus S4-7.
In total, 41 proteins were detected as difference in abundance proteins in the wild-type S4-7 and ΔwblE2 strains (Table 1, Fig. 3). All the detected proteins were identified as proteins of Streptomyces origin after database searching. At 24 h, only six proteins were showed a difference in abundance. In contrast, at 48 h and 72 h, 33 and 34 proteins, respectively, were identified as significantly regulated by the whi transcription factor. Among the difference abundant proteins, 13 were consistently less abundance in the mutant strain. Among the carbohydrate metabolism proteins, two were less abundant proteins and the other two were more abundant proteins. Most of the identified stress response, transport, DNA repair, and amino acid metabolism proteins were more abundant in the ΔwblE2 strain. Interestingly, five transcription-related proteins were detected as difference in abundance, and four of them were significantly less abundant proteins. The four less abundant transcription-related proteins were identified as the cyclic AMP receptor protein/fumarate-nitrate-reductase (crp/fnr) family transcriptional regulator, which is the key transcription factor in antibiotic production in Actinomycetes. The function of the crp/fnr transcription factor, similar to that of whi transcription factors, is known to involve regulation of colony development and spore germination in Streptomyces (Derouaux et al., 2004). Recently, a crp/fnr family transcriptional regulator was described as a global regulator of antibiotic production in Streptomyces (Gao et al., 2012). In our proteomic analyses, crp/fnr genes were significantly less abundant proteins in the Δwhi strain relative to the wild-type strain (Table 1). These results indicate that (1) the whi transcription factor regulates antibiotic production associated with the plant-protective ability of the S4-7 strain in the strawberry rhizosphere; and (2) this transcription factor may act upstream of the crp/fnr genes during colony development and secondary metabolite production. A typical phenotype of the Δcrp comprises reduced colony development and germination, but accelerated sporulation (Derouaux et al., 2004; Gao et al., 2012). By contrast, morphological characteristics of the ΔwblE2 included decreased spore and aerial hypha development.
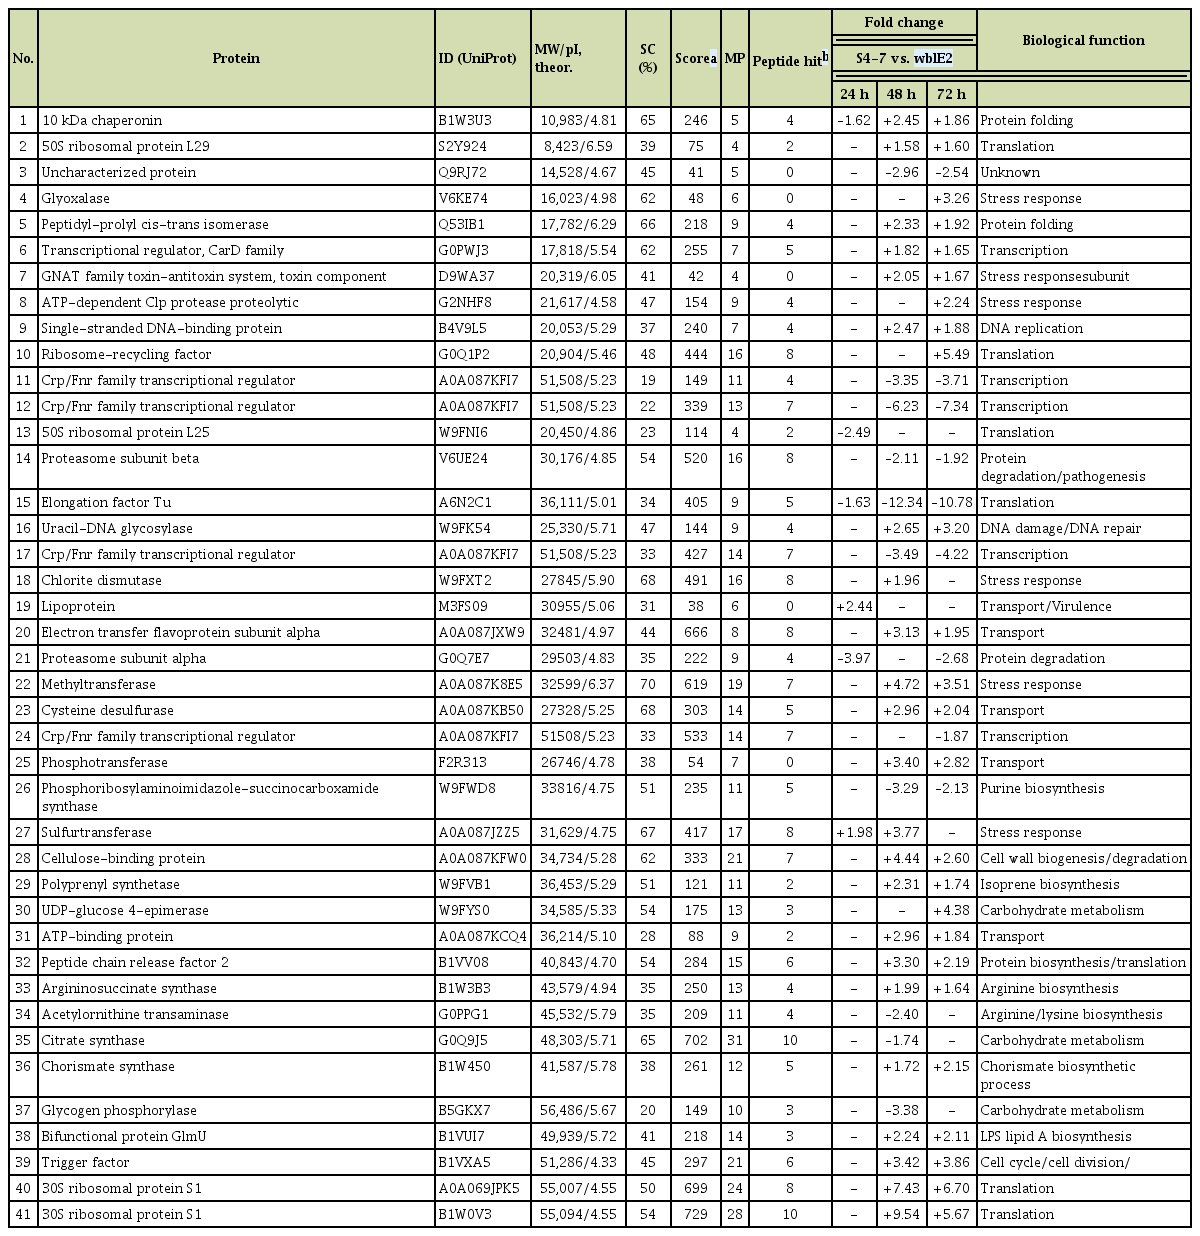
List of difference abundant proteins in the S4-7 and wblE2 mutant during developmental stages

Representative two-dimensional gel electrophoresis image of the S4-7 and wblE2 mutant at different developmental stages. A total of 300 μg of soluble protein was loaded and separated using an immobilized pH gradient strip (17 cm, pH 4-7) and 12% sodium dodecyl sulfate polyacrylamide gel electrophoresis. The numbers on the gels showed differentially expressed proteins between the S4-7 and the whiE2 mutant.
In conclusion, the S. griseus S4-7 strain has exceptional ability to suppress the growth of F. oxysporum f. sp. fragariae; however, the underlying antibiotic biosynthesis pathways and regulatory mechanisms remain to be elucidated. In this study, proteomics mapping of S. griseus S4-7 proteins provided novel insights into these aspects (Fig. 4). All 435 proteins of the strain were observed; among them, 223 proteins were identified. Additional study of these functions is warranted. The present findings establish a foundation to explore the potential of the S. griseus S4-7 strain as a new biocontrol agent.
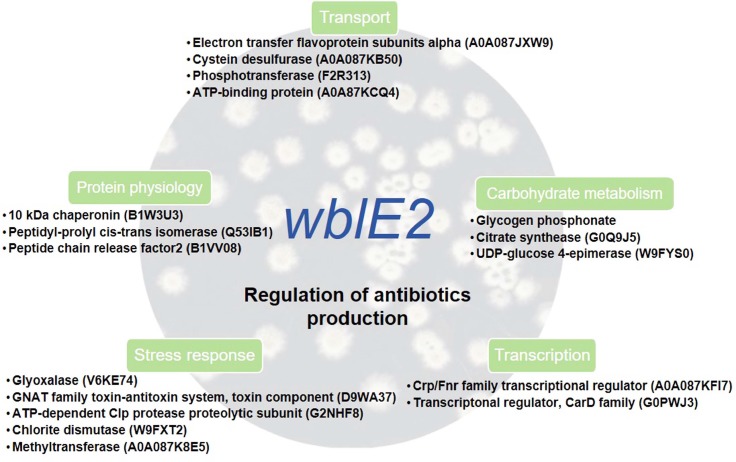
A possible model for the mechanism of action of whi transcription factor in antibiotic production and regulation of Streptomyces griseus S4-7.
Electronic Supplementary Material
Supplementary materials are available at The Plant Pathology Journal website(http://www.ppjonline.org/).
Acknowledgments
This research was supported by the Next-Generation Bio-Green21 Program (PJ013250).