Comparative Analysis of Defense Responses in Chocolate Spot-Resistant and -Susceptible Faba Bean (Vicia faba) Cultivars Following Infection by the Necrotrophic Fungus Botrytis fabae
Article information
Abstract
In this study, resistance responses were investigated during the interaction of Botrytis fabae with two faba bean cultivars expressing different levels of resistance against this pathogen, Nubaria (resistant) and Giza 40 (susceptible). Disease severity was assessed on leaves using a rating scale from 1 to 9. Accumulation levels of reactive oxygen species (ROS), lipid peroxidation and antioxidant enzymes (superoxide dismutase, catalase and ascorbate peroxidase) were measured in leaf tissues at different times of infection. The expression profiles of two pathogenesis-related proteins (PRPs) encoded by the genes PR-1 and β-1,3-glucanase were also investigated using reverse transcription RT-PCR analysis. The accumulation of these defense responses was induced significantly in both cultivars upon infection with B. fabae compared with un-inoculated controls. The resistant cultivar showed weaker necrotic symptom expression, less ROS accumulation, a lower rate of lipid peroxidation and higher activity of the enzymatic ROS scavenging system compared with susceptible cultivar. Interestingly, ROS accumulated rapidly in the resistant leaf tissues and peaked during the early stages of infection, whereas accumulation was stronger and more intense in the susceptible tissues in later stages. Moreover, the response of the resistant cultivar to infection was earlier and stronger, exhibiting high transcript accumulation of the PR genes. These results indicated that the induction of oxidant/antioxidant responses and the accumulation of PRPs are part of the faba bean defense mechanism against the necrotrophic fungus B. fabae with a different intensity and timing of induction, depending on the resistance levels.
Chocolate spot, which is incited by the necrotrophic plant pathogen Botrytis fabae Sard., is one of the devastating diseases of Faba bean (FB) (Vicia faba L.) production worldwide (Rhaïem et al., 2002; Torres et al., 2004), including Egypt (Abo-Hegazy et al., 2012; Abou-Zeid et al., 1990; Khalil and Harrison, 1981). The pathogen attacks all of the aboveground parts of the FB plant, thereby causing chocolate-colored lesions that may spread quickly around the infection site, killing the tissue above the lesion (Bouhassan et al., 2004). In Egypt, yield losses exceed 20–25% (Khalil et al., 1993) and may reach 100% under severe epidemic conditions (Bouhassan et al., 2004; Torres et al., 2004). The deployment of resistant FB varieties is an efficient strategy for controlling the disease and promoting the development of sustainable agriculture (Bouhassan et al., 2004; Rhaïem et al., 2002). However, only limited studies exist on the defense responses of the FB×B. fabae interaction (Sillero et al., 2010).
Plants defend themselves against fungal infection through the activation of complex defense responses (Dangl and Jones, 2001). One of the earliest these responses is the rapid generation of reactive oxygen species (ROS), which includes superoxide anion (O2−), hydroxyl radical (OH•) and hydrogen peroxide (H2O2) (Patykowski and Urbanek, 2003). There are numerous studies demonstrating the production of these free radicals in plants as an initial response to microorganisms, both pathogenic and non-pathogenic (Bolwell et al., 2002; Garcia-Limones et al., 2002; Gill and Tuteja, 2010). ROS may have multiple effects on defense responses, including direct antimicrobial action, lignin biosynthesis, phytoalexin production and the triggering of systemic acquired resistance (Bradely et al., 1992; Lamd and Dixon, 1997; Laloi et al., 2004; Peng and Kuć, 1992). Nevertheless, the excess ROS causes oxidative damage, leads to lipid peroxidation and damages macromolecules such as pigments, proteins, nucleic acids and lipids (Apel and Hirt, 2004). To limit oxidative damage, plants have a defense antioxidative system to modulate the cytotoxic effects of these free radicals, which include enzymes such as superoxide dismutase (SOD), peroxidase (POX), ascorbate peroxidase (APX) and catalase (CAT) (Mittler, 2002). However, the role of ROS in the defense mechanism against necrotrophic fungi (e.g., Botrytis spp.) remains controversial (Asselbergh et al., 2007). Some studies have demonstrated a positive effect of ROS on plant resistance (Malolepsza and Urbanek, 2000; Unger et al., 2005). In contrast, other studies have demonstrated that the level of ROS accumulation in plant tissues was proportionally correlated with the aggressiveness of the necrotrophic pathogens (Govrin and Levine, 2000; Mayer et al., 2001; von Tiedemann, 1997).
Furthermore, in different plant×pathogen interactions, the defense response has been associated with the accumulation of pathogenesis-related proteins (PRs) genes, which are plant species-specific proteins, and their expression is highly associated with enhanced resistance (van Loon, 1997; van Loon and van Strien, 1999). In addition, most PRs possess antimicrobial activities in vitro through hydrolytic activities on cell walls and contact toxicity (van Loon et al., 2006). These proteins have attracted much attention and have become very important resources in the genetic engineering of crop plants for disease resistance (van Loon et al., 2006). PR proteins, which are grouped into seventeen families, show different serological relationships and biological activities (Park et al., 2004; van Loon et al., 2006). The PR-1 represents a group of PR gene families (Sarowar et al., 2005) whose role in disease resistance is often associated with antifungal properties such as the hydrolysis of fungal cell walls (van Loon and van Strien, 1999; van Loon et al., 2006). PR-1 is widely thought to be used as marker gene for systemic acquired resistance in many plant species (Sarowar et al., 2005). PR-2 protein, which has β-1,3-glucanase activity, can inhibit the growth of a fungus either directly by degrading fungal cell walls (Mauch et al., 1988) or by releasing short glucan fragments from pathogen cell walls, which can also act as signal molecules to stimulate further plant defense responses (Ebel and Cosio, 1994). The involvement of PR genes in FB plants after pathogen attack has been previously demonstrated (Attia et al., 2007; Cheng et al., 2012; Rauscher et al., 1999). However, no data are available regarding the differential induction of the above mentioned PR genes in FB cultivars possessing different levels of resistance against B. fabae.
The aim of this study was to identify reliable biochemical and molecular indicators of FB resistance to chocolate spot. In this regard, the disease severity and the accumulation levels of H2O2, lipid peroxidation and antioxidant enzymes (SOD, CAT, POX), as well as the expression of pathogenesis-related PR-1(VfPR1) and β-1,3-glucanases (VfPR2) genes were investigated in two FB cultivars, Nubaria and Giza 40, which are resistant and susceptible, respectively, to chocolate spot during the infection process of B. fabae.
Materials and Methods
Fungal culture and inoculum preparation
An aggressive single-spored B. fabae isolate recovered from a diseased FB plant exhibiting symptoms of chocolate spot disease was used in this study. The fungal isolate was grown on potato dextrose agar plates and incubated at 25°C for 7–10 days. To induce sporulation, the fungal culture was transferred to FB leaf extract medium as described by Leach and Moore (1966) for 10 days at 20–22°C. Conidia were collected by washing plates with 4–5 ml of sterile distilled water, and the resulting spore suspension was adjusted to 3×10⁶ conidia/ml using a hemocytometer (Bouhassan et al., 2004).
Faba bean plants and inoculation
Two FB cultivars, Nubaria (resistant) and Giza 40 (susceptible), were chosen for this study because of their respective resistance and susceptibility to chocolate spot disease in a preliminary screen. The FB cultivars were obtained from the Field Crop Research Institute, Agricultural Research Center, Giza, Egypt. The FB seeds were planted in 15 cm-diameter pots filled with arable soil, peat moss and sand (1:1:1; v:v:v) and kept in an environmentally controlled greenhouse at 24±2°C with a 16-h photoperiod. The germinated seedlings were thinned to one plant per pot. At the beginning of the flowering stage (7-week-old plants), FB plants were individually spray-inoculated to run-off with a conidial suspension of B. fabae (25 ml/plant) supplemented with 0.01% Tween 20. After inoculation, the plants were placed in a moist chamber in a greenhouse at 24±2°C with a 16-h photoperiod.
Evaluation of disease severity
Twenty plants from each cultivar were rated individually for disease symptoms on the leaves at 48, 72 and 120 h post inoculation (hpi) using a qualitative scale of 1–9, where 1 indicates no visible symptoms and 9 represents disease covering more than 80% of the foliar tissue (ICARDA, 1986). The disease severity (DS) for each plant was calculated as follows: DS = {∑i=0n(n × b)} × 100/T × N where b is the infection rating and n is the number of leaves with that rating, N is the maximum number of the rating used on the scale (9) and T is the total number of leaves. Based on the severity values ratings over time, the area under disease progress curve (AUDPC) was calculated as follows: AUDPC = ∑i=0n [(yi + yi+1)/2] [xi+1 + xi] where i = 1,2,3,….n–1, yi is the disease severity, and xi is the time of ith rating (Shaner and Finney, 1977). Five days after inoculation, the disease symptoms were daily monitored and recorded.
Plant defense response
Sampling procedures for plant defense response assays
Leaf samples from nodes No. 4–7 were collected separately at time points of 0, 12, 24, 36, 48, 72 96 and 120 hpi and were immediately frozen in liquid nitrogen (3 FB plants per cultivar for each time interval). The samples from each plant were stored at −80°C and analyzed separately to represent three biological repetitions for various analyses. The control FB plants were only treated with sterilized water.
Assay of H2O2 generation
Hydrogen peroxide was measured by the method discredited by Velikova et al. (2000) with minor modification. Leaf samples were homogenized in 0.1% trichloroacetic acid (TCA) in ratio of 1:10 (w/v) and centrifuged at 12,000×g for 15 min at 4°C. Next, the leaf extract (0.5 ml) was added to 0.5 ml of 10 mM potassium phosphate buffer (pH 7.0) and 1 ml of 1 M potassium iodide and then vortexed briefly. The absorbency of the oxidation product was measured at a wavelength of 390 nm after 5 min using a Jenway 6715 spectrophotometer (Bibby Scientific Limited, Staffordshire, UK). Hydrogen peroxide content was calculated using a standard curve prepared with known concentrations of H2O2 and expressed as mmole/g FW.
Determination of lipid peroxidation
Lipid peroxidation was measured in terms of malondialdehyde (MDA) content, a thiobarbituric acid reactive substance according to Heath and Packer (1968). Leaf samples were homogenized in 0.1% TCA in ratio of 1:5 (w/v) and centrifuged at 12,000×g for 30 min at 4°C. A 1-ml of the leaf extract was incubated with 4 ml of 20% TCA containing 0.5% thiobarbituric acid (TBA) for 30 min at 95°C. The mixture was incubated at 95°C for 30 minutes and then quickly cooled on ice. After centrifugation at 10,000×g for 15 min, the absorbance of the reaction product was measured at 450, 532 and 600 nm. The level of lipid peroxidation is expressed as mmole/g FW of MDA-TBA complex formed using an extinction coefficient of 155/mM/cm.
Antioxidant enzyme assays
Preparation of enzyme extracts
FB leaf samples were immersed in liquid nitrogen and ground into a powder using a mortar and pestle. Soluble proteins were extracted by re-suspending the powder in four volumes of 100 mM phosphate buffer (pH 7.0), containing 100 mM Na-EDTA and 1% (w/v) polyvinylpyrrolidone (PVP). After centrifugation at 10,000×g for 30 min at 4°C, the supernatant was collected and stored at −80°C for further analysis of enzyme activity (Velikova et al., 2000). Protein concentrations were measured according to the Bradford method (1976) with bovine serum albumin as the standard.
Superoxide dismutase (SOD) activity
SOD activity was assayed by measuring its ability to inhibit the photochemical reduction of nitro blue tetrazolium (NBT) chloride according to the methods of Beauchamp and Fridovich (1971) with minor modification. The reaction mixture (1.5 ml) was set up in a test tube containing 50 mM potassium phosphate buffer (pH 7.8), 0.05 mM EDTA, 13 mM methionine, 75 μM nitro blue tetrazolium (NBT), 100 μl enzyme extract and 20 μM riboflavine. The tubes were kept under two 15-W fluorescent lamps for 15 min at 25°C, followed by their transfer to the dark for 15 min. Absorbance at 560 nm was then measured. The amount of SOD that causes a 50% inhibition of NBT reduction was defined as 1 unit, and the SOD activity was expressed as nkat/mg protein.
Catalase (CAT) activity
CAT activity was assayed by measuring the rate of disappearance of H2O2 at 240 nm according to the methods of Cakmak and Marschner (1992) with minor modification. The 1-ml reaction mixture consisted of 50 μl enzyme extract, 25 mM phosphate buffer (pH 7.0), and 10 mM H2O2 diluted in buffer, which initiated the reaction. One unit was defined as the amount of enzyme necessary to decompose 1 μmol/min H2O2 under the conditions of the assay. CAT activity was expressed as nkat mg−1 protein.
Ascorbate peroxidase (APX) activity
APX activity was assayed according to the method of Nakano and Asada (2001) with minor modification. The reaction mixture (1 ml) consisted of 25 mM phosphate buffer pH 7.0 (containing 0.1 mM EDTA), 0.25 mM ascorbic acid and 100 μl enzyme extract. The reaction was initiated by the addition of 10 μl of 10 mM H2O2. Decreased absorbance was observed 1 min after the addition of enzyme extract at 290 nm. One unit was defined as a change in absorbance of 0.1 under the conditions of the assay. APX activity was expressed as nkat/mg protein.
Expression analysis of PR proteins genes
RNA extraction
Total RNA was extracted using TRIzol reagent (Life Technologies, Invitrogen, Carlsbad, CA, USA) according to the manufacturer’s instructions. Leaf tissues (≈100 mg) were ground in liquid nitrogen and homogenized directly in 1 mL of TRIzol reagent solution. The homogenized sample was centrifuged at 8,000×g for 5 min at 4°C. The upper aqueous layer was collected and transferred to a new 1.5 micro-centrifuge tube to which 300 μl of chloroform was added, followed by mixing using a vortex. The mixture was centrifuged at 10,000×g for 15 min at 4°C to separate the phases. The RNA was then precipitated by mixing the aqueous phase with 1000 μl of isopropanol, and the tubes were incubated at −20°C overnight. To pellet the RNA, the tubes were centrifuged at 10,000 ×g for 10 min at 4°C. The supernatant was removed, and the pellet was washed with 500 μl of 75% ethanol and centrifuged at 10,000×g for 10 min at 4°C. The RNA pellet was dried at room temperature and then dissolved in 100 μl RNase-free water. Extracted RNA was treated with DNase (Ambion). The RNA was quantified spectrophotometrically, and the RNA concentration was adjusted to 50 ng/μl and stored at −80°C for further use.
Reverse-transcription PCR analysis (RT-PCR)
The expression patterns of pathogenesis-related PR-1(VfPR1) and β-1,3-glucanases (VfPR2) genes were analyzed by RT-PCR analysis. The forward and reverse primers for the selected genes are shown in Table 1 (Chang et al., 2012). Briefly, first strand cDNA was prepared from 2 μg of mixed stage total RNA primed with oligo-dT using a ProtoScript® First Strand cDNA Synthesis Kit (New England Biolabs) according to the manufacturer’s protocol. All PCR reactions were carried out with 0.5 μl cDNA, 2.5 μl 10× PCR buffer with MgCl2, 0.5 μl 2 mM dNTPs, 1 μl 10 μM of each primer, 0.3 μl Taq DNA polymerase and RNase-free water in a final volume of 25 μl. In the negative control cDNA was replaced by RNase-free water. Reactions were conducted in a Techne TC-412 thermocycler (Barloworld Scientific Ltd, United Kingdom) under the following conditions: an initial 5 min denaturation at 94°C, followed by 35 cycles of PCR (94°C, 30 s; 55°C, 30 s; and 72°C, 1 min), and a final extension period at 72°C for 7 min. The elongation factor 1-alpha (VfELF1A) gene was amplified for 25 cycles and used as a reference gene. The PCR products were analyzed by electrophoresis in 1.5% agarose ethidium bromide gels.
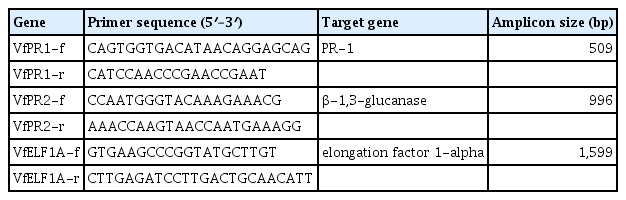
Primers used in RT-PCR analysis to amplify the genes encoding the selected PR proteins (f-Forward, r-Reverse)
Data analysis
The statistical analyses were performed using the SAS software system (SAS Institute Inc., 2003). The data were statistically analyzed in a factorial model of a completely randomized experimental design. For the evaluation of disease severity, the factorial model was 2×3, consisting of two FB cultivars and three evaluation times (48, 72 and 120 hpi) with 20 replicates per treatment. For the determination of H2O2 and MDA concentrations as well as the SOD, CAT, and APX activity measurements, the factorial model was 2×2×6, consisting of two FB cultivars, un-inoculated or B. fabae-inoculated plants, and eight sampling times (0, 12, 24, 36, 48, 72, 96 and 120 hpi) with 3 replicates per treatment. All experiments were conducted twice for reproducibility. Levene’s test was used to check the data for homogeneity of variance and indicated that the data of the two repeats could be pooled into one analysis (Gomez and Gomez, 1984). Analyses of variances (ANOVAs) were performed for all data sets. All data are presented as means, and the statistical significance was indicated at P<0.05. Standard deviations were calculated in Microsoft Excel 2003.
Results
Greenhouse evaluation
The factorial analysis of variance revealed significant effects for FB cultivars, evaluation time and their interaction on the chocolate spot severity (P < 0.001) (Table 2). The severity of infection was expressed as the AUDPC (Table 3). The AUDPC values increased over time for both cultivars. However, the AUDPC values for the resistant cultivar Nubaria were significantly lower than those for the susceptible cultivar Giza 40. Disease symptoms were observed on susceptible plants as necrotic lesions (48 hpi) that developed into expanding and water soaking areas within 96–120 hpi (Fig. 1). The resistant plants showed the appearance of few and restricted necrotic spots (24 hpi), resembling HR. These spots increased in intensity and size with no significant damage to the leaf area until 120 hpi (Fig. 1).
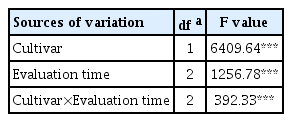
Analysis of variance of the effects of FB cultivars and evaluation time for chocolate spot severity
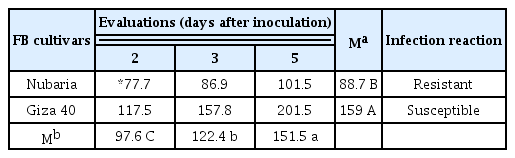
Progress of chocolate spot severity expressed as area under disease progress curve (AUDPC) for two FB cultivars inoculated with a single virulent isolate of B. fabae at different evaluation times after inoculation using whole plant assays
FB leaves inoculated with a single virulent isolate of B. faba 48 hpi, showing restricted necrotic spots, resembling HR (A) observed on resistant (Nubaria) leaves that become increased in intensity and size with no significant damage to the leaf area until 120 hpi; and necrotic lesions (B) observed on susceptible (Giza 40) leaves that developed into expanding and water soaking areas within 96–120 hpi.
Plant defense responses
As shown in Table 4, the effects of the FB cultivars, plant inoculation, sampling time and their interactions were significant (P<0.001) for the H2O2 and MDA content as well as the SOD, CAT, and APX activities.
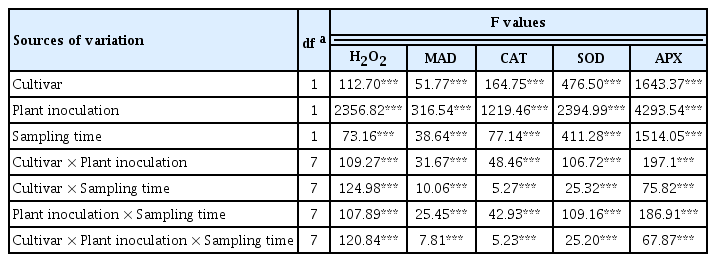
Analysis of variance of the effects of FB cultivars, plant inoculation, and sampling time on the H2O2, and MDA content as well as the SOD, CAT, and APX activities
Assay of H2O2 generation
Inoculation with B. fabae significantly enhanced the accumulation of H2O2 in both the resistant (Nubaria) and susceptible (Giza 40) cultivars compared with the non-inoculated controls (Table 5 and Fig. 2). In general, H2O2 content was significantly higher (P<0.001) in the leaves of the susceptible cultivar than that of resistant ones (Table 5). The levels of H2O2 sharply accumulated in the inoculated resistant tissues and reached the maximum (69.7 mmol/g FW) at the first 24 hpi. This level was 2.9 times higher than that of susceptible tissues, and thereafter a decline in the H2O2 content was observed (Fig. 2).
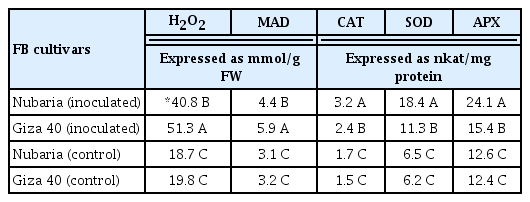
H2O2, and MDA content as well as the SOD, CAT, and APX activities in leaves of resistant (Nubaria) and susceptible (Giza 40) FB cultivars inoculated with a single virulent isolate of B. fabae as compared with un-inoculated controls
Time course of the changes in H2O2 content (expressed as mmol/g FW) in leaves of resistant (Nubaria) and susceptible (Giza 40) FB cultivars inoculated with B. fabae as compared with un-inoculated controls. The experiment was conducted twice and the data for the two experiments were combined. Each value is the means of six replicates (of two experiments). Different letters indicate significant differences at P<0.05. Error bars represent the standard deviations of the mean.
In the susceptible tissues, a significant induction of H2O2 was observed later at 36 hpi. The levels of H2O2 increased with time and reached its maximum (90.2 mmol g−1 FW) at 96 hpi, which was 2.4 times higher than that of the resistant tissues (Fig. 2). No significant changes in the H2O2 levels were detected with time in un-inoculated leaf tissues (Fig. 2).
Lipid peroxidation
The level of lipid peroxidation in leaf tissues was measured as the malondialdehyde (MDA) concentration. Lipid peroxidation levels were significantly higher in pathogen-inoculated leaves when compared with un-inoculated controls (Table 5 and Fig. 3). It was observed that MDA accumulation levels increased with time in the inoculated plants and were significantly higher at all-time points in Giza 40 (susceptible) than in Nubaria (resistant) (Table 5 and Fig. 3). At 96 hpi, the MDA content in the susceptible tissues was 8.6 mmol/g FW, which was 1.6 times higher than that of the resistant tissues (Fig. 3). No significant changes in the lipid peroxidation levels were detected with time in un-inoculated leaf tissues (Fig. 3).
Time course of the changes in lipid peroxidation levels (measured in terms of malondialdehyde (MDA) content (expressed as mmol/g FW) in leaves of resistant (Nubaria) and susceptible (Giza 40) FB cultivars inoculated with B. fabae as compared with un-inoculated controls. The experiment was conducted twice and the data for the two experiments were combined. Each value is the means of six replicates (of two experiments). Different letters indicate significant differences at P<0.05. Error bars represent the standard deviations of the mean.
Superoxide dismutase (SOD) activity
Increased SOD activity in leaf tissues was observed in both cultivars after pathogen inoculation, but this increase was significantly higher in the resistant cultivar (Table 5 and Fig. 4). At 72 hpi, the enzyme activity in the resistant cultivar Nubaria was 24.4 nkat/mg protein, which was 1.5 times higher than that of the susceptible cultivar Giza 40. At this time point, SOD activity continued to increase in the resistant tissues, but it was decreasing in the susceptible tissues (Fig. 4). No significant changes in the enzyme activities were detected with time in un-inoculated leaf tissues (Fig. 4).
Time course of the changes in CAT activity (expressed as nkat/mg protein) in leaves of resistant (Nubaria) and susceptible (Giza 40) FB cultivars inoculated with B. fabae as compared with un-inoculated controls. The experiment was conducted twice and the data for the two experiments were combined. Each value is the means of six replicates (of two experiments). Different letters indicate significant differences at P<0.05. Error bars represent the standard deviations of the mean.
Catalase (CAT) activity
As shown in Table 5 and Fig. 5, the inoculated leaves of both FB cultivars showed significantly higher levels of accumulated CAT than those of un-inoculated controls. In both resistant and susceptible tissues, CAT activity increased gradually and reached its peak on 96 hpi with values of 4.2 and 2.9 nkat mg−1 protein, respectively. However, the induced levels of CAT were significantly higher in the inoculated leaves of the resistant cultivar compared to those of the susceptible cultivar at all-time points investigated (Table 5 and Fig. 5). No significant changes in the enzyme activities were detected with time in un-inoculated leaf tissues (Fig. 5).
Time course of the changes in SOD activity (expressed as nkat/mg protein) in leaves of resistant (Nubaria) and susceptible (Giza 40) FB cultivars inoculated with B. fabae as compared with un-inoculated controls. The experiment was conducted twice and the data for the two experiments were combined. Each value is the means of six replicates (of two experiments). Different letters indicate significant differences at P<0.05. Error bars represent the standard deviations of the mean.
Ascorbate peroxidase (APX) activity
As shown in Table 5 and Fig. 6, APX activity in the un-inoculated controls of each cultivar was significantly lower than that of inoculated plants. In the resistant cultivar, APX activity was higher than in the susceptible cultivar at all-time point investigated. The level of APX reached its maximum (30.5 nkat/mg protein) at 72 hpi in the inoculated resistant tissues, which was 1.7 times higher than that of susceptible tissues at this time point. In susceptible tissues, the increase of APX activity was lower following infection. No significant changes in the enzyme activities were detected with time in un-inoculated leaf tissues (Fig. 6).
Time course of the changes in APX activity (expressed as nkat/mg protein) in leaves of resistant (Nubaria) and susceptible (Giza 40) FB cultivars inoculated with B. fabae as compared with un-inoculated controls. The experiment was conducted twice and the data for the two experiments were combined. Each value is the means of six replicates (of two experiments). Different letters indicate significant differences at P<0.05. Error bars represent the standard deviations of the mean.
Expression analysis of PR proteins genes
As shown in Fig. 7, the expression of pathogenesis-related PR-1(VfPR1) and β-1,3-glucanase (VfPR2) genes in the leaves of the resistant Nubaria and susceptible Giza 40 cultivars in response to inoculation with B. faba at different time points was compared with that of un-infected plants. The accumulation of VfPR1 was observed over time in both the un-inoculated and the inoculated leaves; this accumulation was greater in inoculated leaves and higher in the resistant cultivar compared to susceptible ones.
Reverse-transcriptase polymerase chain reaction (RT-PCR) analysis showing expression patterns of the pathogenesis-related gene 1 (VfPR1) and gene 2 (VfPR2) in the leaf samples of resistant (Nubaria) and susceptible (Giza 40) FB cultivars at different time points after inoculation with B. fabae as compared with un-inoculated controls. The elongation factor 1-alpha (VfELF1A) gene was used as a reference gene. The experiment was conducted twice with similar results.
No transcripts encoding VfPR2 were detected over time in un-inoculated leaves and it was induced in leaves after inoculation with B. faba (Fig. 7). In the resistant cultivar, the levels of VfPR2 expression were detectable as early as 6 hpi, peaked at 72 hpi and remained high for the rest of the time. VfPR2 transcripts displayed a weak accumulation in the susceptible cultivar observed at 24 and 96 hpi, after which the transcript levels declined (Fig. 7).
Discussion
The management of chocolate spot using resistant faba bean (FB) cultivars is a priority strategy to control the disease, but no completely resistant cultivars have been developed so far (Sillero et al., 2010; Villegas-Fernández et al., 2009). The understanding of the biochemical and molecular mechanisms conferring resistance against B. fabae could provide valuable information for breeding new resistant cultivars. In the current study, the reactions of two FB cultivars expressing different levels of resistance against to B. fabae, Nubaria (resistant) and Giza 40 (susceptible), were investigated using whole plant assays to avoid responses induced by wounding and not associated with the infection (Bertini et al., 2003). For both cultivars, there was a significant increase in the chocolate spot severity over time. The progress of the disease symptoms evolved slowly on resistant cultivar but occurred at a much greater rate on the susceptible cultivar. However, disease severity was significantly lower for Nubaria than for Giza 40, regardless of the evaluation time. These results were in agreement with those of Abo-Hegazy et al. (2012) who showed that the Nubaria and Giza 40 FB cultivars were resistant and susceptible, respectively, to infection by B. fabae. The lowest levels of disease severity recorded in the leaves of Nubaria suggest that resistance events that delay tissue colonization after fungal infection play a role in the FB × B. fabae interaction (Hanounik and Maliha, 1986; Hanounik and Robertson, 1988).
The rapid generation of hydrogen peroxide (H2O2), one type of reactive oxygen species (ROS), has been considered as one of the earliest cellular responses in both compatible and incompatible plant×pathogen interactions (Garcia-Limones et al., 2002; Mellersh et al., 2002). In the present study, a significant increase in H2O2 generation in both FB cultivars was observed in response to B. fabae inoculation, compared with un-inoculated plants. These results suggested that the induction of H2O2 in inoculated leaves may be one of the FB defense mechanisms against the invading necrotrophic pathogen. However, the greatest accumulation of H2O2 was detected in the susceptible cultivar Giza 40, indicating that the higher levels of ROS correlated with the susceptibility of FB leaf tissues to infection with B. fabae. Govrin and Levine (2000) showed that the inoculation of B. cinerea induced an oxidative burst in Arabidopsis, and the aggressiveness of this pathogen was directly dependent on the level of ROS accumulation. Additionally, Shi et al., (2011) found that the overexpression of transcription factor AtMYB44 in Arabidopsis resulted in stronger ROS formation, greater cell death and the facilitation of the B. cinerea infection process.
It is interesting that the oxidative burst generation profiles were different between the current FB cultivars. In the resistant tissues, the levels of H2O2 sharply accumulated and reached its maximum at 24 hpi, which was approximately double that recorded in susceptible tissues. Thereafter, a decline in the H2O2 content was noted. In contrast, H2O2 accumulation was stronger and more intense in the susceptible tissues in later stages of infection. Moreover, higher H2O2 concentrations contributed to the formation of restricted necrotic spots in the leaves of the resistant cultivar or expanding and water soaking areas in the leaves of the susceptible cultivar. Malolepsza and Urbanek (2000) showed that B. cinerea conidia were sensitive to H2O2, and higher concentrations of it inhibited fungal mycelial growth. They concluded that if the germination of B. cinerea conidia did not stop at the early infection stages, then high concentrations of H2O2 could not inhibit the mycelial growth inside the host tissues. Patykowski and Urbanek (2003) reported that the resistance of tomato plants against B. cinerea infection resulted from the early induction of H2O2. The same was observed for the interaction of tomato plants with Colletotrichum coccodes causing anthracnose (Mellersh et al., 2002), and Rhizoctonia solani causing tomato foot and root rot (Nikraftar et al., 2013). These observations suggest that the accumulation of H2O2 in the early stage of resistant FB cultivar Nubaria-B. fabae interaction is consistent with its role as an antimicrobial agent or it may function as a signal to trigger other defense responses (Asselbergh et al., 2007; Lamb and Dixon, 1997). At a later stage of disease development, higher intensive H2O2 levels caused destructive changes in the susceptible Giza 40 cultivar and facilitated the invasion and spread of necrotrophs in dead leaf tissues (von Tiedemann, 1997).
Excess ROS leads to the peroxidation of unsaturated lipids of membranes in plants (Apel and Hirt, 2004). MDA content, the secondary end product of lipid peroxidation, has been considered a biochemical indicator of oxidative damage (Heath and Packer, 1968). For the inoculated plants of both cultivars, there was a significant increase in MDA levels during the infection process of B. fabae compared with un-inoculated controls. The high levels of MDA indicated the induction of serious membrane damage in leaf tissues through free radical formation following infection (Govrin and Levine, 2000). The enhanced production of lipid peroxides has been shown in many plant × pathogen interactions (Chavan et al., 2013; Mandal et al., 2011). However, in this study, a positive relationship between the high rates of lipid peroxidation and disease development was found. The accumulation levels of MDA were higher in susceptible leaf tissues than in the resistant ones. These results may indicate that oxidative damage helps the necrotrophic pathogen B. fabae to overcome the plant defense system and aids in successful pathogenesis (Govrin and Levine, 2000).
Plants, however, possess an inherent capacity to eliminate the harmful effects of ROS through the involvement of an antioxidative system that protects cell constituents from the oxidative damage. SOD is the most effective intracellular enzyme in ROS metabolism and catalyzes the dismutation of O2− to H2O2 (Gill and Tuteja, 2010). In the present study, SOD activity was shown to increase in FB leaves infected by B. fabea, but the activity for the resistant cultivar Nubaria was greater than that for the susceptible cultivar Giza 40. This result is in agreement with Debona et al. (2012), who demonstrated that the SOD activity was higher in leaves of wheat cultivar resistant to Pyricularia oryzae than in a susceptible cultivar. It was reported that necrotrophic pathogens, e.g., B. cinerea, induce ROS generation in plants and use these oxidative forces to attack, colonize and destroy host tissues (Asselbergh et al., 2007; Govrin and Levine, 2000; Mandal et al., 2008; Nikraftar et al., 2013). Thus, higher SOD activity in the resistant cultivar Nubaria could be a strategy by which to restrict B. fabea spreading because the excess ROS can be removed (Ehsani-Moghaddam et al., 2006).
CAT is an important enzyme that protects the plant cells from oxidative damage by ROS (Gill and Tuteja, 2010). In this study, FB leaves (resistant and susceptible) inoculated with B. fabae demonstrated a significant increase of CAT activity compared with un-inoculated leaves. However, the induced levels of CAT were significantly higher in the inoculated leaves of the resistant cultivar compared to susceptible one. These differences in the activities between cultivars suggested that CAT plays a major role in FB resistance to chocolate spot. The low enzymatic activities in the susceptible leaf tissues have rendered them less efficient at reducing the high levels of H2O2 during the late stages of B. fabae infection. According to Mandal et al. (2008) a less efficient enzymatic ROS scavenging system, mainly a decrease in CAT activity, explains the high level of damage caused by F. oxysporum f. sp. lycopersici. Additionally, Debona et al. (2012) reported that the leaves of a resistant wheat cultivar infected with P. oryzae accumulated more CAT than did the susceptible cultivars.
APX is thought to play the most essential role in scavenging ROS and protecting cells in higher plants (Gill and Tuteja, 2010). Mandal et al. (2008) reported that the increased production of APX in tomato root inoculated with F. oxysporum counteracted the higher MDA and H2O2 levels and prevents oxidative damage of root tissues. Ge et al. (2014) observed an enhanced activity of APX in muskmelon plants inoculated with Colletotrichum lagenarium, and the level of APX activity was significantly higher in the resistant cultivar. Moreover, Nikraftar et al. (2013) found that the higher levels of APX were associated with the partial resistance of tomato plants to Rhizoctonia solani. These reports are in agreement with the data from the present study, which show that the APX activity was maintained at a higher level in the leaves of the resistant FB plants than in susceptible plants during B. fabea infection process.
Because PR proteins are a constituent of the plant defense strategy, their potential role in the defense against pathogens has been studied extensively in a several plants (Ebrahim et al., 2011). The PR-1 proteins, as well as other PRs, are well known markers for disease resistance and systemic acquired resistance against a pathogen attack (Hong et al., 2005; Mitsuhara et al., 2008). In the present study, the expression levels of the VfPR1 gene were greater in inoculated leaves and higher in the resistant cultivar compared to the susceptible one, demonstrating that this gene is triggered in response to infection and that its induction contributes to the resistance against B. fabae. An increase in the expression level of this protein was reported in FB leaves infected with Uromyces fabae (Rauscher et al., 1999) and Puccinia striiformis f. sp. tritici (Cheng et al., 2012), and in tomato plants infected with Fusarium oxysporum f. sp. lycopersici (Aimé et al., 2008). Systemic resistance against B. cinerea in Arabidopsis plants triggered by an olive marc compost substrate was associated with increased levels of PR-1 (Segarra et al., 2013). Moreover, tobacco plants overexpressing pepper PR-1, were less susceptible to infection with Phytophthora nicotinae, Ralstonia solanacearum and Pseudomonas syringae (Sarowar et al., 2005).
After infection, the transcript profiles of VfPR2 gene were differently expressed between susceptible and resistant cultivars. The response of the resistant cultivar Nubaria was earlier and stronger, showing high transcript levels after infection. The induction of this gene following infection with its known involvement in defending against fungi (van Loon et al., 2006), indicates that this gene might be involved in the FB resistance response against B. fabae. These results are in agreement with those showing a positive correlation between plant resistance and increased levels of β-1,3-glucanase (Aimé et al., 2008; Cota et al., 2007; Ebrahim et al., 2011). However, the earlier induction of VfPR2 gene in the resistant cultivar suggests the presence of mechanisms that ensure the earlier triggering of defense responses to B. fabae compared to the susceptible cultivar. Such an earlier induction of VfPR2 could be related to the early activity of the corresponding protein in releasing short β-1,3-glucan elicitors from pathogen, which are capable of further enhancing the induction of defense-related genes (Ebel and Cosio, 1994).
In conclusion, the levels of H2O2 and lipid peroxidation increased in both susceptible and resistant FB plants due to infection with a necrotrophic pathogen, but the increased levels in susceptible plants were more considerable (particularly in the later stages of infection). However, more efficient antioxidative system in the removal of the excess of ROS generated during the infectious process limits the cellular damage, coupled with earlier and higher expression of PR genes transcripts in the infected resistant tissues compared to susceptible tissues may contribute to a greater resistance against chocolate spot. Therefore, the expression analyses of these defense responses could be used as biomarkers to predict the resistance to B. fabae in FB cultivars.
Acknowledgment
This study was supported by the Deanship of Scientific Research, College of Food and Agriculture Sciences, Research Center, King Saud University.