Profiling of Disease-Related Metabolites in Grapevine Internode Tissues Infected with Agrobacterium vitis
Article information
Abstract
Green shoot cuttings of 10 different grapevine species were inoculated with Agrobacterium vitis to find disease-related metabolites in the grapevine. Crown galls formed 60 days after inoculation varied in gall severity (GS) evaluated by gall incidence (GI) and gall diameter (GD), which were classified into three response types as RR (low GI and small GD), SR (high GI and small GD), and SS (high GI and large GD), corresponding to resistant, moderately resistant, and susceptible responses, respectively. In this, 4, 4, and 2 Vitis species were classified into RR, SR, and SS, respectively. Gas chromatography mass spectrometry (GC-MS) analysis of the grapevine stem metabolites with A. vitis infection showed 134 metabolites in various compound classes critically occurred, which were differentially clustered with the response types by the principal component analysis. Multivariate analysis of the metabolite profile revealed that 11 metabolites increased significantly in relation to the response types, mostly at post-inoculation stages, more prevalently (8 metabolites) at two days after inoculation than other stages, and more related to SS (7 metabolites) than RR (3 metabolites) or SR (one metabolite). This suggests most of the disease-related metabolites may be rarely pre-existing but mostly induced by pathogen infection largely for facilitating gall development except stilbene compound resveratrol, a phytoalexin that may be involved in the resistance response. All of these aspects may be used for the selection of resistant grapevine cultivars and their rootstocks for the control of the crown gall disease of the grapevine.
Introduction
Crown gall of grapevine reduces the grape yield by 20% to 40% and trunk diameter approximately by 9%, compared to uninfected healthy grapevines (Schroth et al., 1988). The causal agent of the grapevine crown gall, Agrobacterium vitis, is a different biovar from other Agrobacterium spp. because it can induce a grapevine-specific crown gall (Panagopoulos and Psallidas, 1973). A. vitis has host specificity-related genes, such as pehA, which encodes polygalacturonase that is hypothesized to facilitate A. vitis attachment and systemic colonization on susceptible grapevine tissues (Burr and Otten, 1999). Another host specificity-related gene function is tartrate utilization, and the host specificity is explained by the use of tartaric acid from specific organic acids in grapevines (Salomone et al., 1996).
Crown gall disease is one of the difficult diseases to eradicate by chemicals in vineyards. As a strategy to prevent crown gall disease without chemical sprays, the use of resistance plant cultivars and antagonistic microbial species have been developed. Some grapevine species, mostly Vitis vinifera, are susceptible to crown gall disease, and thus, rootstocks from resistant species or crossed seedlings are used by many vineyards to prevent crown gall disease on the scions of the susceptible grapevine cultivars (Süle and Burr, 1998). Another prevention strategy is the use of a non-tumorigenic A. vitis strain as host-specific biological control of grapevine crown gall, in which its pretreatment inhibits transformation by tumorigenic A. vitis strains on the grapevine, leading to the inhibition of crown gall induction (Kaewnum et al., 2013; Zäuner et al., 2006).
Recently, various platforms have been used to attempt to identify disease resistance-related metabolites in grapevine, including nuclear magnetic resonance (NMR) spectroscopy (Browne and Brindle, 2007) and liquid chromatography mass spectrometry (LC-MS) (Ehrhardt et al., 2014). However, when using gas chromatography mass spectrometry (GC-MS), extracted metabolite-profiling data can annotate information from the metabolite libraries (Warren, 2013). Derivatization techniques are required to process GC-MS metabolite profiling (Knapp, 1979). Silylation is the most suitable derivatization method for non-volatile metabolites, such as hydroxyl and amino compounds (Pierce, 1968). One silylation agent, N-methyl-N-(trimethylsilyl)-trifluoro-acetamide (MSTFA), has been used to reveal the whole range of metabolites in plants (Fiehn et al., 2000; Lisec et al., 2006; Roessner et al., 2000). However, the highest advantages of GC-MS analysis in metabolomics are noted as well-organized stable protocols from sampling to data analysis, covering relatively a broad range of compound classes (Lisec et al., 2006).
Principal component analysis (PCA) is an unsupervised method that attempts to create a model of the data without a priori information, which is able to provide an overview of the whole metabolite profile and find the differential metabolite profiling within the group using a qualitative analysis (Pearson, 1901). Projections of latent structures (PLS) analysis is a supervised analytical method that enhances the separation between groups, combining variable importance for projection (VIP) scores to obtain a proper cutoff value and increase its performance (Chong and Jun, 2005; Wold et al., 2001). Orthogonal projections of latent structures (OPLS) analysis add a single component to the PLS analysis as a predictor of the model, and the other components describe the variation orthogonal to the first predictive component (Westerhuis et al., 2010). OPLS-discriminant analysis (DA) provides useful information about putative biomarkers using an S-plot that combines the covariation and correlation from the model in a scatter plot (Eriksson et al., 2006). The VIP score in PLS-DA and correlation value in OPLS-DA provide cutoff values for finding significant metabolites. This experimental method using GC-MS and multivariate data analysis can identify new aspects of pathogenicity-related metabolites.
Genetic, physiological and morphological changes of the host plant to the infection of Agrobacterium species and in the crown gall development have been well documented in relation to plant responses to the tumorigenic bacterium before T-DNA transfer and during gall development (Gohlke and Deeken, 2014). However, relatively little has been studied on those changes occurring in the non-tumorigenic plant tissues that have been influenced by the disease development (gall development), which may broaden the holistic understandings of plant responses to the crown gall pathogen infection and disease development. This may enhance their practical applicability in the disease control; e.g., use of crown gall-resistant rootstocks. Therefore, in the present study, we examined metabolite profiling in the intermodal tissues of grapevine species in relation to plant responses to the crown gall development in grapevines induced by the infection of A. vitis using GC-MS and statistical multivariate data analysis.
Materials and Methods
Grapevines, pathogen, and pathogen inoculation
Grapevines (10 Vitis spp.) used in our study were obtained from the National Clonal Germplasm Repository (NCGR; United States Department of Agriculture-Agricultural Research Service [USDA-ARS], Davis, CA, USA). For Vitis spp., 11 to 22 green shoot cuttings were collected from NCGR fields in June 2015 and placed in a perlite bed for rooting at 25°C with mist for one month. The green shoot cuttings with root systems were transferred to a pot with bed soil for pathogen inoculation test. The pathogen, kindly provided by Dr. Burr, Cornell University, was A. vitis. K305. The bacterium was cultured on potato-dextrose agar (PDA) (Difco; BD, Sparks, MD, USA) at 25°C for three days. The bacterial cultures grown on PDA were collected by the agar surface scratching in sterile distilled water (SDW), and the population density was examined by dilution plate method (Dhingra and Sinclair, 1985), which was diluted with SDW to make a bacterial suspension with a concentration of 109 colony-forming units (cfu) ml−1. For inoculation, a wound (about 1.0 mm deep) was made in the internode of the green shoot using a 2-mm-day drill and 10 μl of the bacterial suspension was injected into the wound using a micropipette. After inoculation, the wound site was immediately wrapped with sealing film (Parafilm; American National Can, Neenah, WI, USA) and the green shoot cuttings were grown at 25°C in a greenhouse. Symptom development was examined every other day after inoculation throughout the experimental period.
Evaluation of responses of Vitis species to A. vitis K306 infection
Responses of grapevine species (cultivars) to the crown gall pathogen infection were examined at 60 days after inoculation based on the crown gall development, which was estimated by gall severity (GS) index (GSI) that was evaluated by gall incidence (GI) and gall diameter (GD) index (GDI) as GI × GDI that was 0 = 0.0 (no gall), 1 = 0.1–1.5 mm, 3 = 1.5–5.0 mm, and 5 = above 5 mm of GD (Ferreira and van Zyl, 1986), and expressed as averages and standard deviations of 11–22 replications depending on the number of shoot cuttings used for the Vitis species tested. The plant responses were classified into different response types based on GI, GD, and GSI of Vitis species into RR (low GI and small GD), SR (high GI and small GD), and SS (high GI and large GD), respectively, based on significant differences in GSI at P ≤ 0.05 by Tukey’s honest significant difference (HSD) test, corresponding to resistant, moderately resistant, and susceptible plant responses to the bacterial infection, respectively.
Tissue sampling
Grapevine internodal tissues were sampled at four different stages: pre-inoculation stage (pre), two days before inoculation; postinoculation stage 1 (post 1), two days after inoculation; post 2, seven days after inoculation; and post 3, 30 days after inoculation. For all grapevine species, fresh stem tissues of about 100 mg around the inoculation sites were cut off each from three stem tissues and placed in a 0.5-ml microtube followed by the addition of liquid nitrogen and kept at −80°C in a deep freezer until use.
Extraction of total metabolites from the sampled tissues
Total metabolites were extracted from the frozen tissue samples using a modified extraction method developed by Fiehn et al. (2008). Briefly, about 20 mg of each sample was placed in a 1.5-ml Eppendorf tube containing 1 ml of pre-cooled extraction buffer (degassed methanol, chloroform, water; 5:2:2, [v/v/v]). Samples were macerated at 1,750 rpm for 1 min at 4°C using a ball mill (MM301; Retsch Corp., Hann, Germany). After tissue maceration, the samples were vortexed for 10 s and shaken for 6 min at 4°C on an orbital mixing plate (Torrey Pines Scientific Instruments, Carlsbad, CA, USA). Plant debris was discarded as of the precipitate after centrifuging for 2 min at 14,000 rcf using a bench-top centrifuge at 4°C (Eppendorf 5415D). The supernatant (500 μl) was transferred into a new 1.5-ml Eppendorf tube and dried using a vacuum concentrator (Centrivap cold trap concentrator; Labconco, Kansas, MO, USA). For derivatization, 20 μl of methoxyamine solution (Sigma 226904; Sigma-Aldrich, St. Louis, MO, USA) containing 20 mg ml−1 pyridine (Sigma 270407; Sigma-Aldrich) was added to dried sample tubes and shaken for 90 min at 30°C. To each tube, 91 μl MSTFA (Fluka 68768; Sigma-Aldrich) and 10 μl FAME marker (Supelco C8–C24; Sigma-Aldrich) were added and then shaken for 30 min at 37°C. Each prepared sample was transferred to an autosampler vial with a micro-insert (Supelco #24722; Sigma-Aldrich).
GC-MS analysis
The GC-MS system consisting of a gas chromatograph and mass detector (Leco Pegasus IV mass spectrometer; LECO Corp., St. Joseph, MI, USA) was used for GC-MS analysis of the metabolites extracted from the tissue samples. A 0.5 μl sample was injected into the liner in splitless mode, and the liner was exchanged every ten samples. The injection temperature started at 50°C and ramped to 250°C by 12°C per sec. The GC column was a Rtx-5Sil MS (Restek, 30 m × 0.25 mm) at a constant flow of 1 ml min−1 helium gas. The column temperature started at 50°C for 1 min and then ramped to 330°C. Automatic mass spectral deconvolution was performed with peak detection of GC spectrum using The BinBase algorithm (rtx5). After peak peaking, peak data were deposited BinBase DB with BinBase ID. BinBase settings: validity of chromatogram (peaks with intensity > 107 counts s−1), unbiased retention index marker detection (MS similarity > 800, validity of intensity range for high m/z marker ions), retention index calculation by 5th order polynomial regression. Spectra are cut to 5% base peak abundance and matched to database entries from most to least abundant spectra using the following matching filters: equivalent to about ± 2 s retention time, unique ion must be included in apexing masses and present at > 3% of base peak abundance, mass spectrum similarity must fit criteria dependent on peak purity and signal/noise ratios (5:1). Failed spectra are automatically entered as new database entries if s/n > 25, purity < 1.0 and presence in the biological study design class was > 80%. Resulting .txt files were exported to a data server with absolute spectral intensities and further processed by a filtering algorithm implemented in the metabolomics BinBase DB (Kind et al., 2009).
Multivariate data analysis
For statistical analysis, the spectrum peak data were divided by the square root of the standard deviation of each sample variance (Pareto scaling; Van den Berg et al., 2006). Statistical analysis of metabolic profiles obtained by PCA and OPLS were analyzed using SIMCA-P + software (ver. 12.0, Umetrics, Umea, Sweden; Eriksson et al., 2006). Before obtaining the S-plot, potential metabolites related to response types were selected based on VIP score > 1 and P ≤ 0.05 (Azizan et al., 2012). For these metabolites that were significantly related to response types, their GC-MS data were grouped in three different response types of Vitis species (4 RR, 4 SR, and 2 SS), of which GC-MS data were analyzed again statistically for their relationships with response types by employing Fisher’s least significant difference (LSD) test based on critical values from the t-distribution table at P ≤ 0.05 (two-tailed), followed by the analysis of variance (ANOVA) in a completely randomized design.
Results
Responses of grapevine species to A. vitis K306 infection in the inoculation test
Responses of grapevine species (cultivars) to the crown gall pathogen infection were examined at 60 days after inoculation, forming well or poorly developed galls in the inoculation sites of the grapevine stem internodes (Table 1, Fig. 1). Cultivars’ responses could be classified into three response types by Tukey’s HSD as SS (high GSI; high GI and large GD), RR (low GSI; low GI and small GD), and SR (moderate GSI; high GI and low GD) (Table 1). In this, two Vitis species (V. hybrid and V. flexuosa) were classified as SS with the highest GSI of 4.46 and 4.29, respectively, four species including V. amurensis, V. vinifera, V. coignetiae, and V. hybrid classified as SR with GSI of 2.57 to 2.36, and four (V. riparia, V. rupestris, V. acerifolia, and V. rotundifolia) as RR with the lowest GSI of 1.50 to 0.69, showing significant (P ≤ 0.05) differences in GSI between SS and RR with SR that was not significantly differentiated from the other two response types (SS and RR) (Table 1).

Crown gall formation on grapevines infected with Agrobacterium vitis K306 at 60 days after inoculation
Crown galls formed on grapevine stem internodes (arrows) with different response types at 30 days after inoculation with Agrobacterium vitis K306. (A) DVIT 1595 (Vitis rupestris) with RR (resistant). (B) DVIT 2119 (V. hybrid) with SS (susceptible).
GC-MS analysis
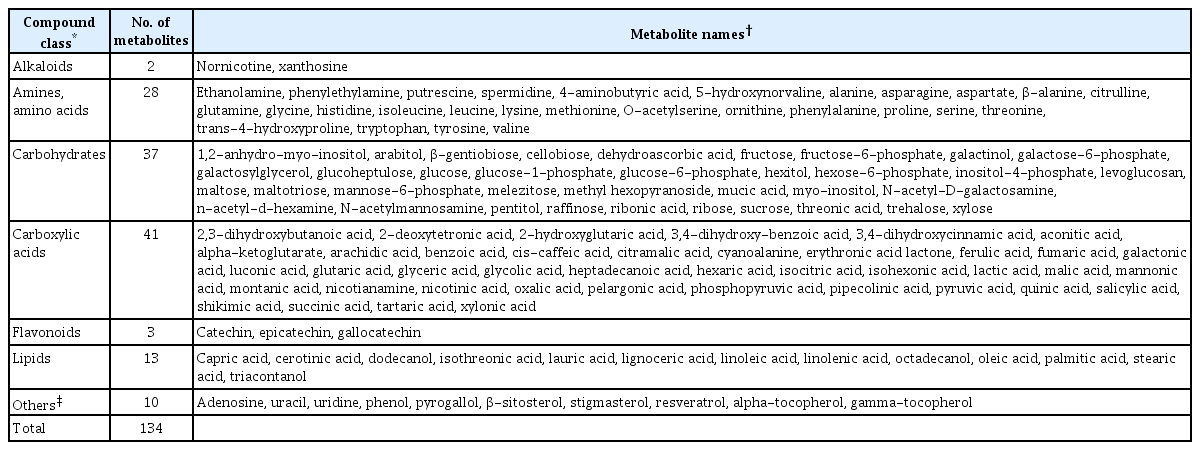
For metabolic profiling of each sampled tissue (with three replications for each Vitis species), the GC peaks of the total metabolites were annotated, identifying 134 metabolites in each replicated sample using the metabolomics Fiehn DB (Table 2). Among these detectable metabolites, the most abundant component class was carboxylic acids that contained 41 metabolites, the least one was alkaloids including only 2 metabolites (nornicotine and xnathosine), and also the other classes identified were 28 amines and amino acids, 37 carbohydrates, 3 flavonoids, 13 lipids and 10 nucleic acids and others such as phenolics, steroids, stilbenes and vitamins (Table 2).
GC-MS-based metabolite profile in grapevine stem internodes infected with or without Agrobacterium vitis
Multivariate data analysis
PCA plots revealed clustering patterns of Vitis species with three response types at one pre- and three post-inoculation stages, in which each dot represented one tissue sample from one Vitis species (Fig. 2). This shows the dots of tissue samples from Vitis spp. with the same response types distributed in closer distances than those with other response types, indicating the Vitis spp. were clustered differentially corresponding to response types depending upon the first and second principal components (metabolites). Significant relations of the spectral peak areas of the detectable metabolites with response types were analyzed by the cross-validation ANOVA (CV-ANOVA) using OPLS-DA, in which 11 metabolites were selected to be significantly related to response types (Supplement Table 1, Fig. 1). These metabolites were composed of 5 amino acids, 2 carbohydrates, 2 carboxylic acids, 1 flavonoid, and 1 stilbene, for which the GC-MS data for each of three tissue samples from all 10 Vitis species with three response types were analyzed for their significant relationships with response types using LSD (Table 3). Based on their significant increases relative to either or both of the other two response types, one metabolite (cellobiose) was significantly increased in RR relative to SR at pre-inoculation stage; four (asparagine, gallocatechin, tyrosine, and cellobiose) significantly increased in SS relative to other response types, two (glutamine and histidine) in SS relative to SR, and two (sucrose and resveratrol) in RR or SR relative to SS at post 1; all three metabolites (cellobiose, gallocatechin, and quinic acid) increased in SS relative to SR and/or RR at post 2; and two (valine and xylonic acid) increased in RR relative to SR and other two response types, respectively, and one (sucrose) in SR relative to RR at post 3 (Table 3). Totally among the 11 metabolites, 7 metabolites increased in SS and 4 in RR at post-inoculation stages, while at pre-inoculation stage (in healthy non-inoculated plants) only one metabolite (cellobiose) was increased in RR, which was also significantly increased in SS at post-inoculation stages (Table 3).

Principal component analysis plots of Vitis species with three different response types of RR (resistant; low gall incidence [GI] and small gall diameter [GD]), SR (moderately resistant; high GI and small GD), and SS (susceptible; high GI and large GD) at two days before (pre) and two days (post 1), 7 days (post 2), and 30 days post inoculation (post 3) with Agrobacterium vitis K306. PCA plots contained two principal components, PC1 is x axle and PC2 is y axle, each component accounted for x% of total variations.
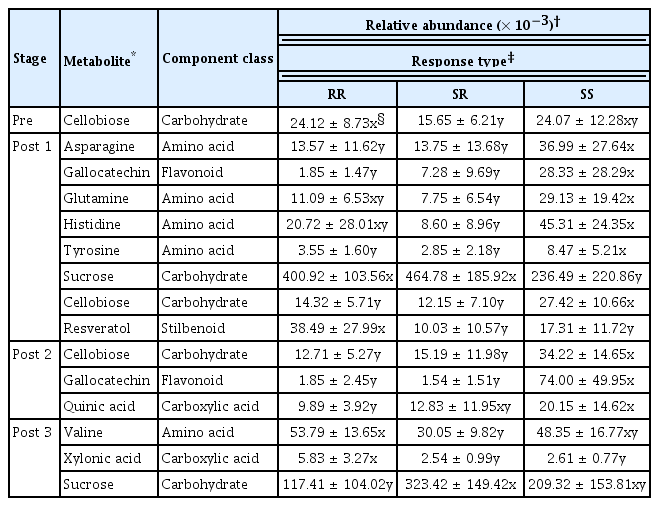
Relative abundance of the GC-MS-based metabolite profiling in grapevine stem internodes in responses to the infection Agrobacterium vitis K306 at different infection stages
Discussion
A variety of previous studies on crown gall disease resistance revealed variable experimental results depending on the pathogen biovars and grapevine genotypes (Dercks and Creasy, 1989; Mahmoodzadeh et al., 2004; Roh et al., 2003; Stover et al., 1997; Süle et al., 1994). Previously, the crown gall resistance locus (Rcg1) was found in the genome of V. amurensis (Kuczmog et al., 2012), but subspecies of V. amurensis show variable degrees of resistance against different A. vitis isolates (Ferreira and van Zyl, 1986; Stover et al., 1997; Szegedi et al., 1984). V. flexuosa is an East-Asian grapevine species with high resistance to crown gall disease (Szegedi et al., 1984); however, it was susceptible to A. vitis, forming large galls with high GIs in our study. Thus, pathogen biovars and plant genotypes should be determined before the use of resistant plant cultivars as tools for plant protection against the crown gall disease.
Plant resistance, as one of control means, is interference with certain stages in the development of a disease cycle (Agrios, 2005). The crown gall disease cycle is composed of pathogen attachment to the wounded plant cells and tissues, T-DNA transfer, integration into the host genome, the expression of virulence genes (vir), and production of phytohormones, which can be differentiated into the initial infection stages up to T-DNA integration for host cell transformation (before T-DNA transfer) and later stages of gall developmental resulting from cellular hyperplasia and hypertrophy (Agrios, 2005; Gohlke and Deeken, 2014; Süle et al., 1994).
At the molecular level for resistance in initial infection stages, a lack of bacterial propagation, induction of vir, and incomplete integration of T-DNA result in crown gall resistance in grapevines (Gelvin, 2010). V. riparia that showed RR in our study had a broad range of crown gall resistance by particularly inhibiting the integration of A. vitis T-DNA into plant chromosome (Stover et al., 1997; Süle et al., 1994). This type of resistance prevents the pathogen from infection, resulting in the reduced GI, leading to no or little gall development to have also lowered GDI, which may be applied as a major resistance mechanism for the four Vitis species of RR. For SR, GI was similar to SS, but GDI, to RR, suggesting the pathogen infection in SR occurs as in SS, but gall development is retarded as in RR to have moderate GSI between SS and RR. For SS, both A. vitis T-DNA integration into host genome and expression of encoded plant oncogenes and increase in phytohormone levels occur readily, resulting in the formation of tumors and their proliferation (Gohlke and Deeken, 2014).
Out of a total 134 metabolites produced in the grapevine stem internodes infected with A. vitis K306, 11 metabolites were significantly related with response types of 10 Vitis species examined in our study. At pre-inoculation stage, only one metabolite (cellobiose) was significantly increased in RR relative to SR, while all 11 metabolites were significantly increased in either SS or RR at post-inoculation stages, suggesting metabolic changes may occur preferentially around the infection sites after the pathogen infection, especially at initial stages of the pathogen infection (at 2 days after inoculation in our study) with response type-related 8 metabolites, of which 6 (4 amino acids, 1 flavonoid, and 1 carbohydrate) related to SS but only 2 most significantly related to RR (resveratrol; phenolic) and SR (sucrose; carbohydrate). At post 2 (at 7 days after inoculation), all three metabolites (one for each of carbohydrate, carboxylic acid, and flavonoid) were more related to SS than RR or SR; however, at post 3 (30 days after inoculation inoculation) all three metabolites (amino acid, carboxylic acid, and carbohydrate) were more related to RR or SR than SR and/or SS. These all suggest that the metabolic changes occur actively in relation to susceptible responses at the initial stages after the pathogen infection, but in relation to resistant responses at later infection stages with full gall development.
An amine derivative, octopine, produced by the octopine-type A. vitis used in our study (Burr et al., 1999) and two plant hormones, auxin and cytokinin, produced in the T-DNA transformed plant cells, drive the uncontrolled gall development, determining gall morphology depending on the ratios of the plant hormones (Gohlke and Deeken, 2014; Morris, 1986; Smits et al., 2008). However, neither octopine and its amino acid component arginine nor the plant hormones were produced in a significant level around the infection sites in our study, suggesting the gall-inducing metabolites may hardly be transported out of the tumorigenic tissues. However, the component class most abundantly produced in relation to response types was amino acid in our study, including 4 amino acids (asparagine, glutamine, histidine, and tyrosine) produced at post 1 and one (valine) at post 3, which was significantly related to SS and RR, respectively. The functions of these amino acids in crown gall development have not been clearly understood, but amino acids are generally involved in the primary metabolism of all living organisms, and the developing tumor becomes a metabolic sink accumulating metabolites to be supplied in a priority for its growth by the induction of vascular tissue differentiation around gall surface (Aloni et al., 1995). It was reported previously that three SS-related amino acids except tyrosine increase several folds in tumor tissue at later infection stage (35 days after Agrobacterium tumefaciens infection) (Deeken et al., 2006), suggesting also these SS-related amino acids should be related to the gall development, although the time for the production of the materials may differ depending on Agrobacterium species. Other component classes of the metabolites such as carbohydrates and carboxylic acids which were increased in SS at 2 and 7 days after inoculation, respectively, may also serve for the gall growth and differentiation by inducing vir genes; gallocatechin, a flavonoid, may be involved in the gall formation as a potential auxin transport regulator as in root nodulation and root-knot gall formation (Wasson et al., 2006, 2009). Quinic acid, catechins, and stilbene are related to Pierce’s disease, showing these metabolites occur at great levels in xylem tissues of the grapevine infected with Xylella fastidiosa (Wallis and Chen, 2012; Wallis et al., 2013).
In plants, major resistance-related responses (defense responses) to Agrobacterium spp. occur at two periods of time, initially at the time of recognizing the tumorigenic pathogens and later during the time of the pathogenesis (gall development) in which auxin and cytokinin cause an increase of ethylene that together with salicylic acid inhibits agrobacterial virulence (Gohlke and Deeken, 2014). In our study, resveratrol at post 1 and valine and xylonic acid at post 3 were definitely differentiated as RR from the other response types (Table 3). Resveratrol is a stilbenoid, a type of natural phenol, and a phytoalexin (known as a plant defense-related material in resistant plants) produced naturally by several plants in response to injury or pathogen infection (Frémont, 2000; Gatto et al., 2008). In grapevine, resveratrol is primarily found in the grape skin and produced as phytoalexin in grapes infected with the grey mold pathogen, Botrytis cinerea, of which the accumulation amounts vary with grapevine genotypes, their geographic origin, and exposure to fungal infection (Favaron et al., 2009; Mattivi et al., 1995). Considering the biological characteristics of this stilbene compound (resveratrol), this metabolite may be produced in Vitis species with RR at a significant amount and act as a phytoalexin to inhibit the growth and virulence of the tumorigenic pathogen (A. vitis) probably more at initial infection stages. For the other metabolites increased in Vitis spp. with RR at the later infection stages (30 days after inoculation), valine (amino acid), and xylonic acid (carboxylic acid), their roles in plant responses are not clearly understood. Alterations in the plant metabolism in response to different pathogen infections may function as either supporting the ongoing defense mechanism to lead an efficient resistance response or being exploited by the pathogen to facilitate infection as can be seen in plant glutamate metabolism (Seifi et al., 2013). Thus, it is not an unusual thing that the metabolites in the same compound classes were differentiated in relation to the opposing response types; xylonic acid significantly related to RR at post 3, while quinic acid to SS at post 2; valine related to RR at post 3, while four amino acids (asparagine, glutamine, histidine, and tyrosine) to SS at post 1 in our study. Considering the same class metabolites concomitantly occurred in relation to different response types at different infection stages, the same class metabolites may play different roles depending on their requirements for in situ metabolism, leading to either compatible or incompatible responses to the pathogen infection
In our study, sucrose contents were highest in grapevine stem internodes with SR at post 1 and post 3, which was significantly differentiated from SS at post 1 and RR at post 3, respectively (Table 3). Considering the increased expression of sucrose degradation enzyme genes in gall tissues of Arabidopsis and its induction of Agrobacterium virulence genes (Cangelosi et al., 1990; Deeken et al., 2006), the increased sucrose contents may support its intake into the metabolic sink, crown gall tissue, contributing to the gall development in different degrees depending on infection stages (Aloni et al., 1998). Host sucrose, synthesized from photosynthetic products (glucose) in the cytoplasm of aerial plant parts, is transported to tumor cells apoplastically and the sucrose contents in phloem sap differ depending on the crown gall-developmental stages with higher around actively growing young galls than old matured ones (Malsy et. al., 1992; Mistrik et al., 2000). In our study, the sucrose contents fluctuated with time after infection and were higher at post 1 than post 3, regardless of response types, suggesting the uptake of sucrose should be required for the gall development. Another carbohydrate cellobiose was significantly higher in RR relative to SR at preinfectional stages, but higher in SS than RR and SR at post 1, suggesting its roles in healthy plant tissues may alter oppositely in diseased plant tissues with uncontrolled gall development.
In our study, metabolite profile analysis revealed the following aspects: Remarkable differential increases of metabolites (11 metabolites) occurred in internodes of Vitis species after A. vitis infection, most prevalently (8 metabolites) at two days after inoculation, and more related to susceptible type of response (SS) for 10 metabolites that are useful for the metabolic processes in gall growth and differentiation as nutritional compounds or plant hormone regulator. Among three metabolites (resveratrol, valine, and xylonic acid) definitely differentiated into the resistant response (RR), resveratrol appeared to be importantly related to resistant responses as it is a well-known phytoalexin compound in several plant pathosystems. All of these aspects will provide important information that can be applied for the selection of grapevine cultivars resistant to the crown gall disease caused by A. vitis, and their use as rootstocks for the control of the crown gall disease in the scions of the grapevines susceptible to A. vitis.
Supplementary materials
Acknowledgments
We are honored to thank Dr. Thomas Burr at Cornell University for providing Agrobacterium vitis K306 for the crown gall pathogen inoculation test. I would like to thank Drs. Daniel Kluepfel and Ali McClean for providing the disease test facilities. This work was supported by a grant from the International Collaborative Research Program (No. PJ0085432015), Rural Development Administration, Republic of Korea.
Notes
Articles can be freely viewed online at www.ppjonline.org.